


Pennant Pattern in Trading: Identification and Breakout Strategy
FXOpen
The pennant pattern is a continuation chart formation frequently observed in forex and CFD markets during periods of strong directional momentum. It develops after a sharp price movement followed by a brief consolidation phase, reflecting temporary equilibrium before potential trend continuation.
Unlike reversal patterns, a pennant forms within an existing trend structure and is commonly used by traders to analyse breakout conditions, organise entry planning, and define risk parameters using measurable price projections. The pattern’s compact structure allows market participants to evaluate volatility contraction and subsequent expansion within a clearly defined technical framework.
This article examines how bullish and bearish pennant patterns are identified across different market environments, how breakout scenarios are evaluated step by step, how price targets are derived using the flagpole measurement method, and how false breakouts can be filtered through confirmation techniques and professional trading tools.
What Are Pennant Chart Patterns?
A pennant pattern is a short-term continuation chart formation that develops after a sharp directional price move and signals a potential breakout in the direction of the prevailing trend. The pennant pattern’s structure is:
- Flagpole — a strong impulsive move driven by momentum and liquidity imbalance.
- Consolidation phase — price compresses within converging trendlines.
- Breakout — volatility expansion as price exits the pattern in the direction of the prior trend. The breakout should be accompanied with high volumes.
Pennants reflect a pause in momentum rather than a structural reversal.
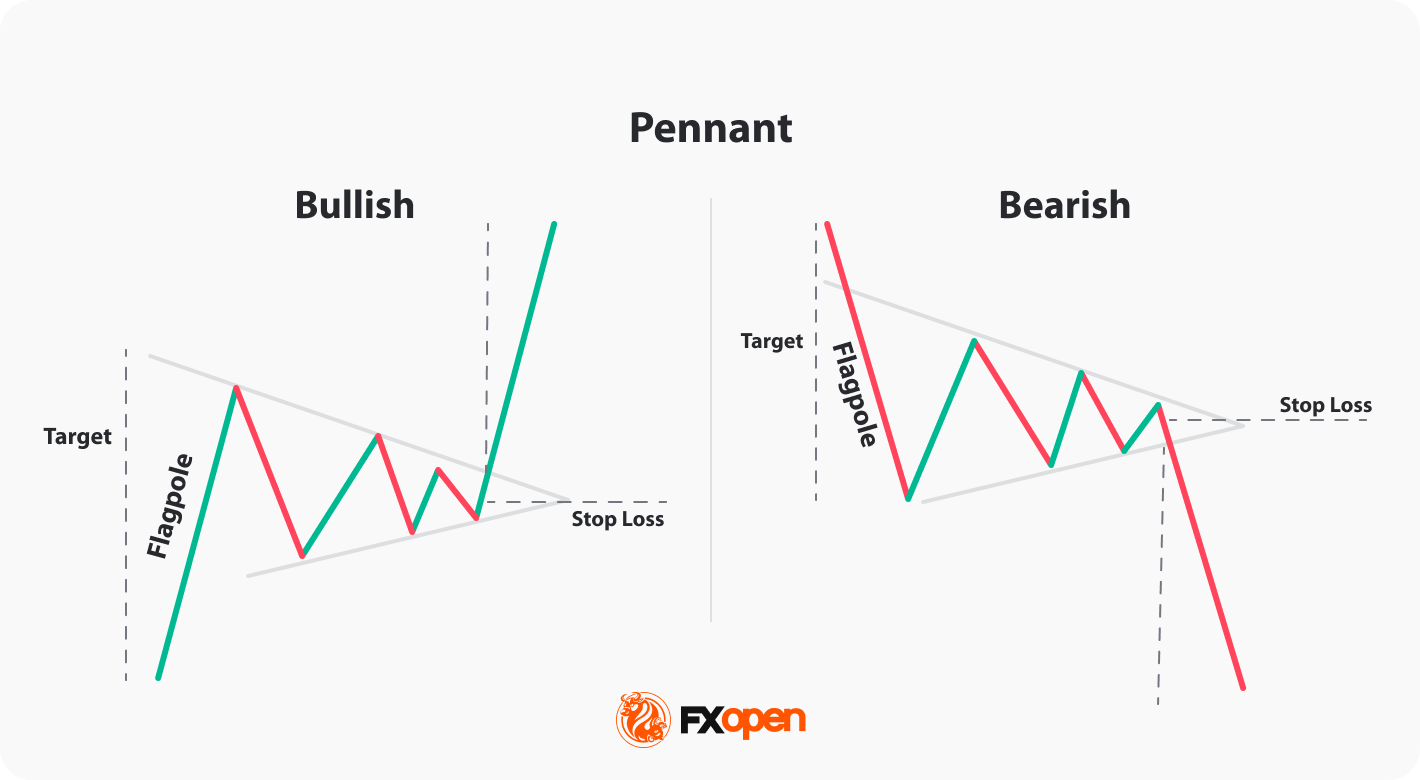
Bullish Pennant Pattern
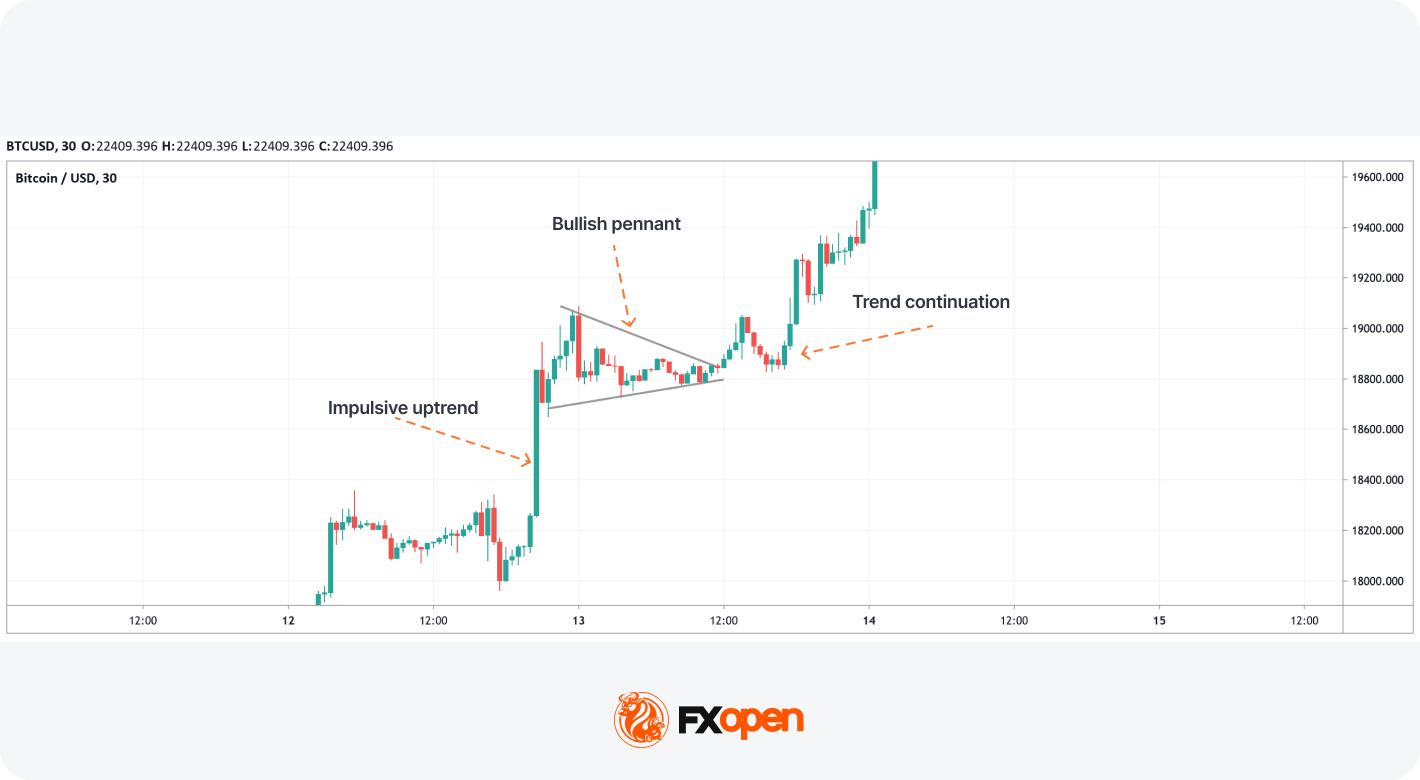
A bullish pennant pattern forms after a strong upward impulse. The consolidation appears as a small symmetrical triangle sloping slightly against the prior trend. A breakout above the upper boundary signals potential continuation higher.
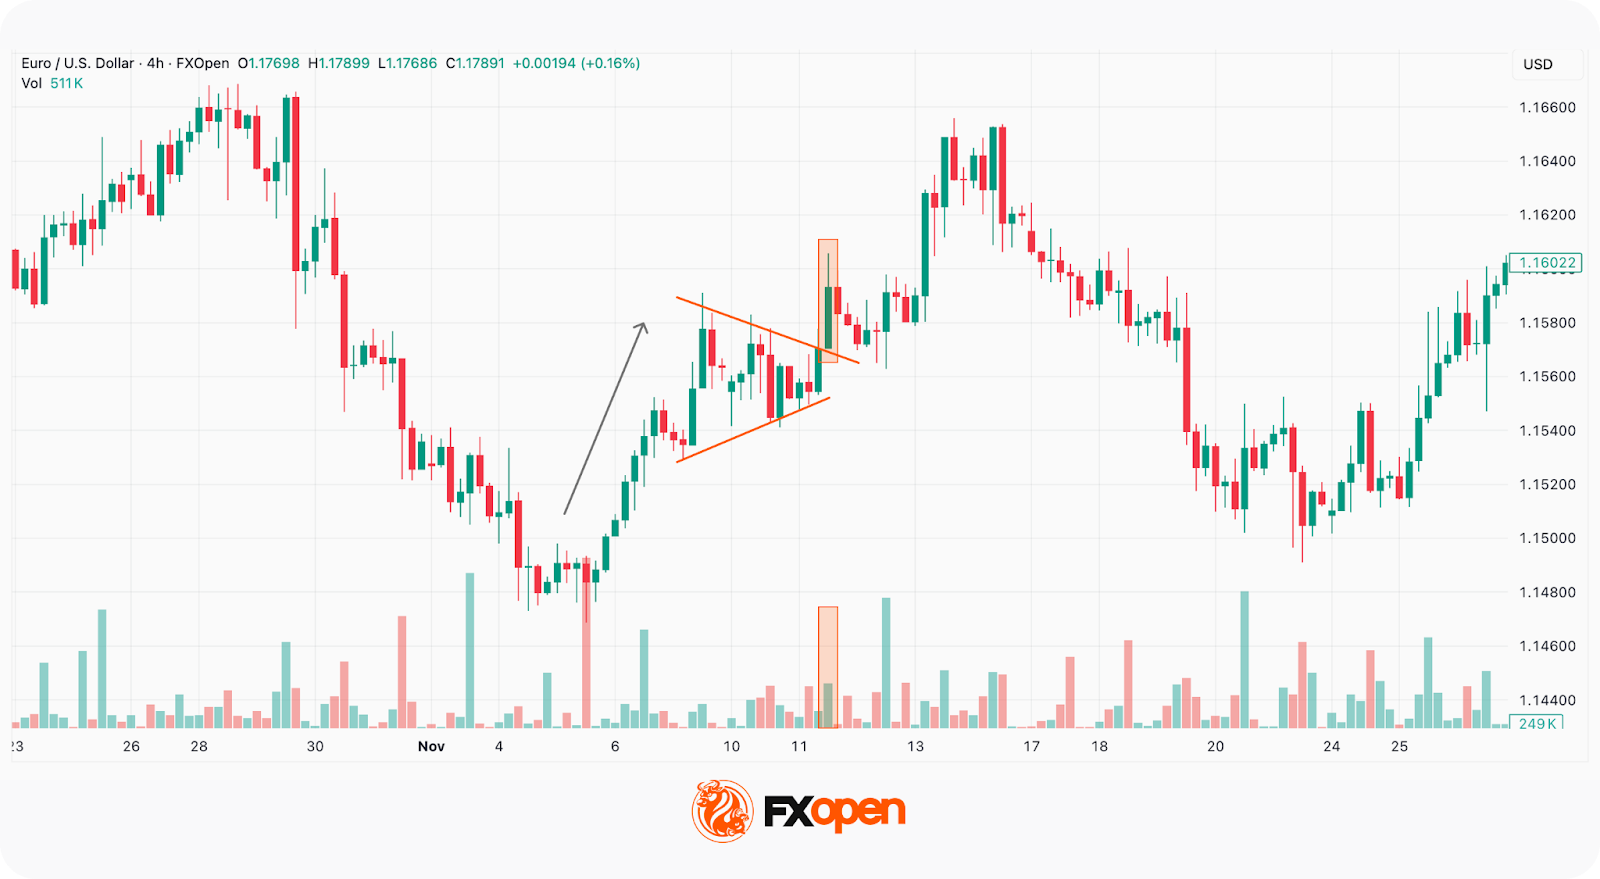
This setup frequently appears in trending currency pairs such as EUR/USD during macro-driven momentum phases.
Bearish Pennant Pattern
A bearish pennant develops after a sharp decline. Price consolidates within converging trendlines before breaking below the lower boundary, indicating further downside continuation.
In high-volatility markets such as cryptocurrencies*, bearish pennant trading setups often form during strong sentiment-driven selloffs.
How Pennant Patterns Form in Live Forex & CFD Markets
In real market environments, pennants often develop during:
- Central bank policy decisions
- Important macroeconomic data releases
- Institutional repositioning
- Liquidity imbalances
The initial impulse creates directional imbalance. During consolidation, volatility contracts and volume typically declines. As price compresses, stop orders accumulate outside the structure. The breakout phase triggers these orders, accelerating momentum through volatility expansion.
This contraction-to-expansion transition is the core edge of pennant trading strategies.
Pennant Pattern Checklist for Traders
- Strong flagpole (impulsive move)
- Tight symmetrical consolidation
- Declining volume during compression
- Volume confirmation breakout
- Breakout aligned with higher timeframe trend
How Traders Identify and Trade a Pennant Pattern (Step-by-Step)
Identifying a valid pennant pattern requires precision. Not every consolidation qualifies.
If you would like to find the formations yourself, consider using the TickTrader trading platform with over 700 instruments and 1200 trading tools.
Step 1: Identify a Strong Flagpole
A valid pennant begins with a sharp, one-sided move supported by expanding momentum.
Without a strong flagpole, the pattern loses statistical edge.
Step 2: Confirm Tight Consolidation
Characteristics:
- Decreasing volatility
- Converging trendlines
- Shallow retracement (ideally <50–60% of flagpole)
Step 3: Wait for a Confirmed Breakout
Breakout should:
- Close decisively beyond upper/lower boundary
- Align with higher timeframe direction
- Show strong momentum expansion
Traders avoid entering inside the pattern. The setup becomes valid only after confirmed breakout structure not to be trapped by false breakouts.
Breakouts during major news events may cause slippage and spread widening.
Step 4: Apply Entry Techniques
Professional traders typically choose between:
- Momentum entry (enter immediately after breakout close)
- Retest entry (wait for pullback to broken boundary). Retest entries might improve risk-to-reward ratio.
Step 5: Use Pennant Pattern Target Calculation
Use the flagpole projection method:
- Measure the length of the flagpole
- Project it from breakout point
Alternative targets:
- Key support/resistance
- Fibonacci extensions
- Fixed risk-reward ratios (1:2 or 1:3)
Step 6: Implement Pennant Pattern Stop-Loss Placement and Risk Management
Common stop-loss placements:
- Beyond opposite pennant boundary
- Below/above recent swing point
Additional risk management considerations:
- Minimum risk-to-reward ratio (e.g., 1:2)
- Trailing stop adjustments after breakout confirmation
- Limit exposure across correlated instruments
When Traders Avoid Trading Pennant Patterns
Traders don’t trade if:
- Retracement exceeds 60%
- Breakout lacks momentum
- Higher timeframe contradicts setup
- Major resistance/support sits inside projected target
Case Study: Bullish Pennant Breakout Strategy
To understand how a pennant pattern works in live market conditions, let’s examine a structured bullish breakout example on EUR/USD.
Market Context
The downtrend reversed with a solid upward momentum. Although there was no confirmation on a higher timeframe, traders could consider trading the pennant pattern.
A strong, impulsive bullish move developed over two days with large-bodied candles and no pullbacks. This created the flagpole, establishing directional bias.
Following the impulse, the price entered a tight consolidation, with converging trendlines forming and momentum temporarily pausing. This compression phase lasted for several days.
The breakout occurred in the direction of the prior trend with a strong bullish candle close.
Aggressive traders could enter on a breakout close. Conservative traders could wait for a retest of the broken resistance.
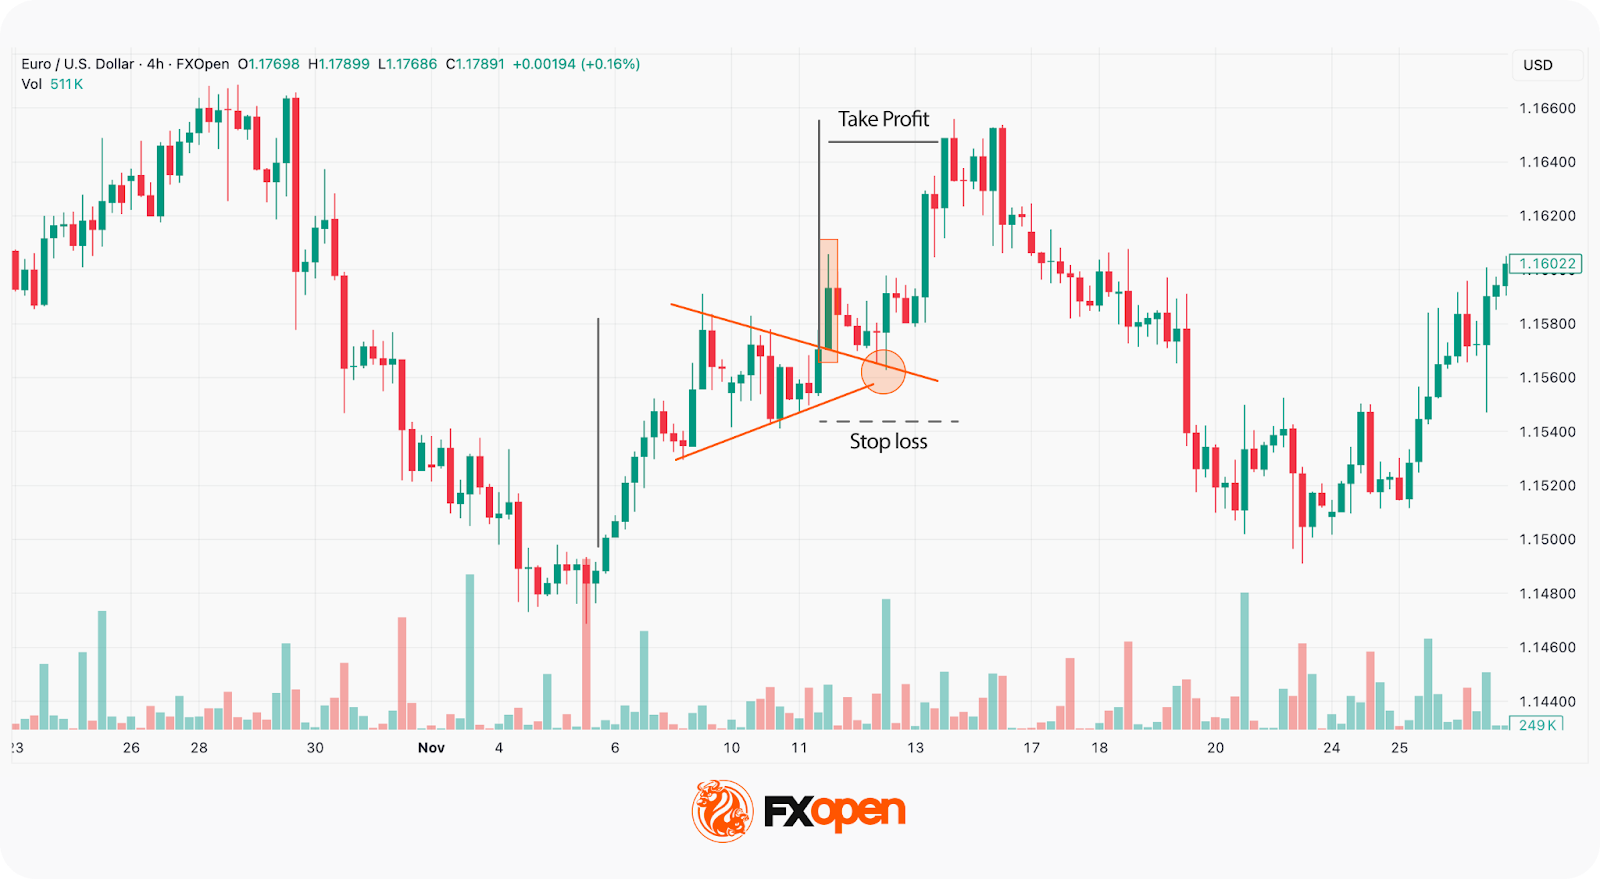
Trade Structure
Entry: Traders could enter at a retest of the broken trendline
Stop-Loss: Below the lower boundary
Target: Flagpole projection method, but with amendments. Although one of the rules states that the price is supposed to rise as far as the length of the flagpole, markets aren’t perfect. Therefore, many traders prefer to set a smaller target, taking into account recent price movements.
Why This Setup Worked
This example aligned with several high-probability conditions:
- Clean compression structure
- Breakout with momentum expansion
- No immediate resistance overhead
The setup demonstrates that pennants are not traded based on shape alone — they require context, confirmation, and disciplined execution.
You can test your own strategies across more than 700 instruments at FXOpen’s TickTrader trading platform.
Statistical Reliability of Pennant Patterns
Professional traders evaluate pennant formations within a broader market framework rather than as isolated chart patterns. Pattern performance is primarily influenced by objective market conditions, including:
- Higher-timeframe trend alignment
- Momentum persistence following the impulse leg
- Relative volume expansion during breakout
- Presence of directional liquidity and absence of equilibrium conditions
Trade outcomes, however, also depend on execution variables specific to the trader, such as:
- Entry model and confirmation criteria
- Risk management methodology
- Position sizing discipline
- Behavioural consistency during volatility expansion
According to research by Thomas Bulkowski in Encyclopedia of Chart Patterns, pennants are classified as moderately reliable continuation patterns.
In trending environments, measured-move targets are frequently achieved. In low-liquidity or sideways markets, failure rates increase.
Timeframes for Trading Pennants
Timeframe affects pattern’s reliability:
- Intraday (M15–H1): More signals, more noise
- H4–Daily: Cleaner structure
- Weekly: Institutional continuation setups
According to Thomas Bulkowski’s Encyclopedia of Chart Patterns, pennants form within up to 3 weeks. They are shorter than symmetrical triangles and wedges.
Brian Shannon explains how to trade in multiple timeframes in his Technical Analysis Using Multiple Timeframes.
Market-Specific Considerations
- Forex. Major pairs like EUR/USD respond strongly to policy divergence cycles.
- Cryptocurrencies*. Cryptocurrencies* display higher volatility, which may result in more false breakouts.
- Equity indices. Stock indices often form cleaner structures in sustained institutional trends. However, the pattern usually lasts no longer than three weeks, which means that it’s not very common on index charts.
Pennant vs Flag vs Symmetrical Triangle
Understanding structural distinctions between pennant pattern vs flag pattern vs symmetrical triangle pattern might improve trade selection and risk control.
Pennants differ from flags in that they show price compression rather than gradual retracement. Compared to symmetrical triangles, pennants are smaller and typically form over shorter durations during high-momentum conditions.
John Murphy widely explains the difference between pennant and flag patterns in his book Technical Analysis of the Financial Markets.
Common Pennant Trading Mistakes
Even experienced traders misinterpret compression structures. Frequent errors include:
- Entering before breakout confirmation. Acting inside the pennant, without confirmation, often means making a wrong decision. The pattern only matters once the price breaks cleanly.
- Trading consolidation without a clear flagpole. Not every consolidation is a pennant. If the lines don’t converge, or if the move before it wasn’t sharp and one-sided, it’s probably not a pennant. Forcing the pattern can lead to poor results.
- Ignoring higher timeframe trends. A pennant ahead of major resistance/support or against the broader trend weakens the setup. Context always matters more than the shape alone.
- Overlooking key macro catalysts. Important economic and political events can invalidate technical compression structures by abruptly shifting liquidity and volatility conditions.
- Neglecting volume analysis. A valid pennant typically shows declining volume during consolidation followed by expansion on breakout; without participation confirmation, price moves are statistically more prone to false breakouts.
Pattern shape alone is insufficient. Context and confirmation determine the edge.
Advantages and Limitations
Pennants are useful in strong trending markets, but they’re not perfect. Let’s take a look at the formation’s advantages and disadvantages.
Advantages
- Clear Structure: Pennants have three clear parts — the sharp flagpole, the tight consolidation, and the breakout offer a straightforward sequence.
- Works Across Timeframes: Pennants occur on many timeframes: from 5-minute charts to daily or weekly ones. That makes them useful for numerous kinds of strategies.
- Defined Breakout Levels: The converging trendlines naturally give a clear area to watch for breakout behaviour.
Limitations
- False Breakouts: Breakouts that stall quickly can trap traders, especially in choppy markets.
- Easily Confused: A messy pennant can look like a triangle or flag. If the structure isn’t clean, the signal can be harder to interpret.
- Relies on Existing Trend Strength: If the initial move is weak or inconsistent, the pennant can be less meaningful. It needs momentum to have the highest probability of working out.
Is It Possible to Improve Pennant Signals?
Like any pattern, the pennant isn’t foolproof. However, traders use certain methods when building a trading strategy around pennants.
Aligning With Trend Tools
Pennants are used in strong trends. You can use tools like moving averages to confirm them. For example, if the price is above the 50-period EMA and the pennant forms during a steady uptrend, that adds weight. A breakout above a short-term moving average can strengthen the case.
Momentum indicators can also help. If the Relative Strength Index (RSI) sits comfortably above 50 while the bullish pattern forms, or breaks out above 50 alongside the pennant, that can confirm a bullish trend and vice versa. However, if the RSI shows overbought/oversold conditions and the market does look very overstretched, that might be a sign to hold off or manage risk more carefully.
Using Volume as a Filter
Volume can give clues. During the pennant, volume may dry up and signal a pause. However, if the breakout coincides with strong volume, that can show genuine interest as buyers or sellers rush in to take advantage of a possible new trend leg. If it stays low, the move may fail or reverse due to a fake breakout.
Pairing It with Context
A pennant is just part of a broader story. For instance, if the market is bouncing off of a resistance level, creates an impulsive flagpole and then forms a bear pennant, that might add conviction to the pattern. However, if the breakout is straight into a major support level, traders might consider looking for a bullish reversal pattern instead.
Alignment between timeframes and correlated assets can be valuable too. If a pennant on the 1-hour chart occurs during a larger trend on the daily, that may add weight. Likewise, if there’s a bullish pennant forming on EUR/USD while dollar weakness is apparent across the board, there might be a higher probability that the bullish breakout is genuine.
Final Thoughts
The pennant pattern is a valuable tool, which provides useful insights into potential price trends. However, it may provide false signals; therefore, to trade with a pennant, you need to be familiar with technical analysis and be able to interpret charts.
You can explore live charts and apply these techniques using the FXOpen TickTrader platform, which provides 700+ instruments and advanced charting tools.
Consider opening an FXOpen account today and trade forex and CFDs on indices, commodities, and crypto* with:
- Spreads from 0.0 pips**
- Commission from $1.50**
- Fast execution
- Institutional-grade liquidity
FAQ
What Is a Pennant Pattern?
The pennant meaning refers to a short-term continuation pattern that forms after a sharp price move. It’s made up of a brief consolidation phase with converging trendlines, then followed by a breakout in the same direction as the original move. It can signal an impending continuation trend leg.
How Do Traders Trade a Pennant Pattern?
Traders usually wait for the price to break out of the pennant on rising volume in the same direction as the initial move. The height of the flagpole is typically used as a rough target, while stop losses are set beyond the last swing high/low or opposite pattern’s boundary.
What Happens After a Bullish Pennant?
A bullish pennant typically leads to further upside if the price breaks above the pattern’s upper trendline with strong momentum.
What Is the Difference Between a Bull Flag and a Bull Pennant?
Bull flags and bull pennants both follow strong upward moves and signal a trend continuation. The key difference between a pennant and a flag is structure. The price in a flag drifts lower or moves sideways within parallel lines that form a sloping or horizontal channel. The price in a pennant contracts into a small symmetrical triangle with converging trendlines.
*Important: At FXOpen UK, Cryptocurrency trading via CFDs is only available to our Professional clients. They are not available for trading by Retail clients. To find out more information about how this may affect you, please get in touch with our team.
**Additional fees may apply.
This article represents the opinion of the Companies operating under the FXOpen brand only. It is not to be construed as an offer, solicitation, or recommendation with respect to products and services provided by the Companies operating under the FXOpen brand, nor is it to be considered financial advice.
Stay ahead of the market!
Subscribe now to our mailing list and receive the latest market news and insights delivered directly to your inbox.


Latest articles

Intel at a Crossroads: Earnings Beat Meets Technical Resistance
Intel has just delivered its strongest quarter in over fifteen years, and the market reaction says it all. Q2 2026 revenue surged 25% year-over-year to $16.1 billion, crushing the consensus estimate of $14.42 billion, while adjusted EPS of

Tesla: Complex Range Structure Breaks Down Following Quarterly Earnings
Tesla released its Q2 2026 results after the market closed on 22 July. Revenue increased 26% year-on-year to $28.24 billion, while vehicle deliveries reached a record 480,126 units. However, operating margin fell sharply to 1.4%, down from

Pound Weakens After Soft UK Inflation Data as Euro Awaits Fresh Market Signals
The pound remains under pressure following the release of weaker-than-expected UK inflation data. The slowdown in inflation has strengthened expectations that the Bank of England could adopt a more accommodative policy stance in the coming months, weighing on sterling. Meanwhile,