


How to Trade on Hidden Bullish and Bearish Divergences
FXOpen

Traders use different tools to understand the financial market. Among these, divergence patterns stand out as particularly significant. A divergence occurs when the market trajectory on a chart deviates from the predictions of a technical oscillator or indicator. This discrepancy subtly suggests potential shifts in markets. There are hidden and regular divergences. In this article, we will delve into hidden bearish and bullish patterns.
Understanding Divergence
First, let's see what divergence means on a chart. In essence, a divergence is all about discrepancies between the market trend and the behaviour of a technical tools. When they don’t move in harmony, it's a sign that the current price movement might be running out of steam, hinting at a possible change in direction.
There are two main types of divergences:
- Classical or regular: it is more commonly seen and usually predicts a trend reversal.
- Hidden: although harder to detect, it usually suggests a trend continuation.
What Is a Regular Divergence?
A regular or classic divergence is identified using specific rules in relation to price direction and the behaviour of a technical tool. Here's how you can spot it:
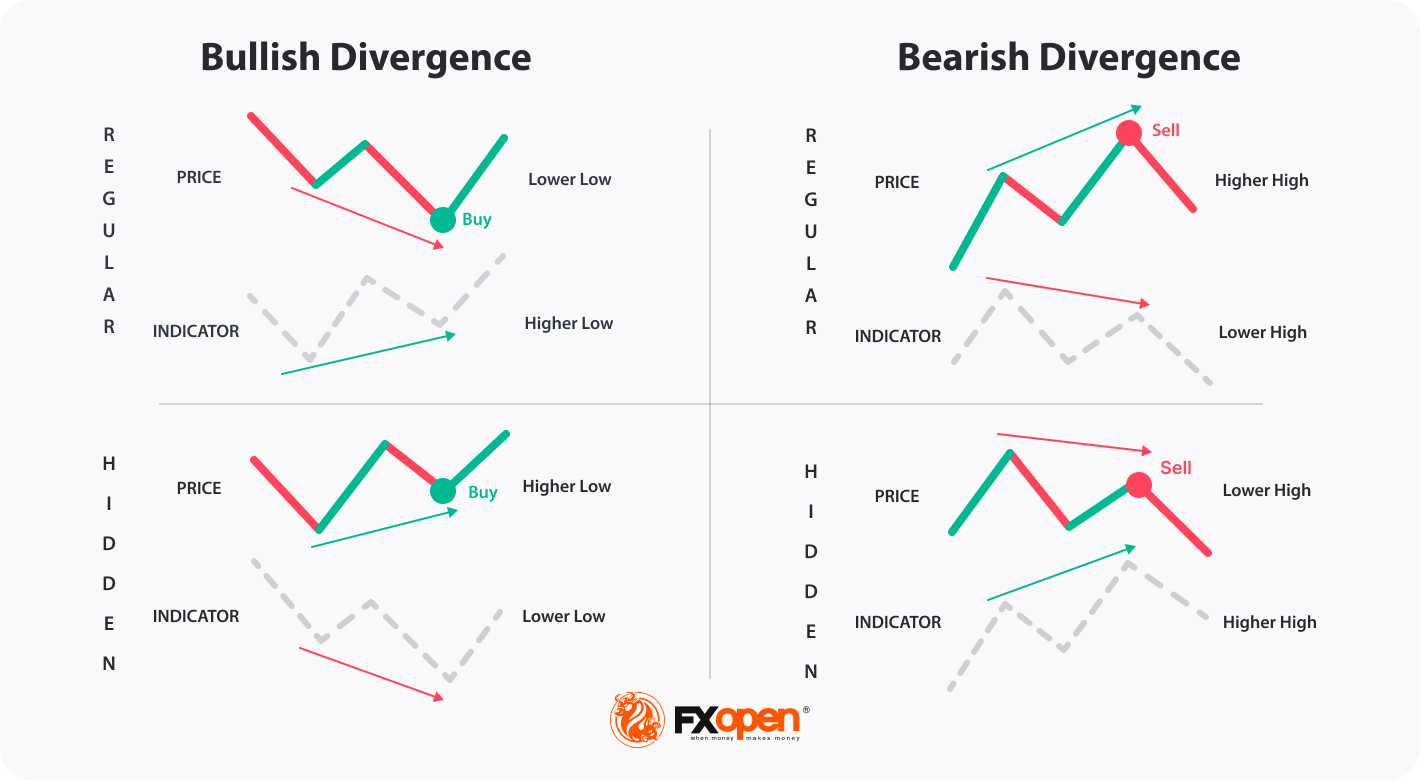
Bullish Regular: It is seen when the market forms lower bottoms, but the oscillator (e.g., MACD, RSI) forms higher bottoms and suggests that the downward price movement is losing momentum, and a potential reversal to the upside might be on the horizon.
Bearish Regular: It is the opposite of a bullish pattern and appears when the market forms higher highs, but the oscillator sketches lower highs. This indicates that the upward movement might be weakening, and a potential downside reversal could be near.
What Is a Hidden Divergence?
The term hidden is used to describe this phenomenon since the divergence is often not readily apparent. Here's how hidden bullish and bearish patterns actually function:
- A hidden bullish divergence arises when prices mark higher bottoms, but the indicator sketches lower bottoms. Thus, traders expect the upward price movement will continue.
- Contrarily, a hidden bearish divergence is observed when prices delineate lower peaks, but the indicator plots higher peaks. Thus, traders expect the downward price movement to continue.
Hidden Divergence vs Regular Divergence
When comparing these types, it is important to note that the former typically occurs at the end of a trend, while the latter appears at the end of a consolidation phase.
You might be wondering why it matters. Regular or classical divergences act as reversal signals, while hidden divergences, which occur after the consolidation period ends, are useful as continuation signals, indicating that the main trend is about to resume.
How to Identify Hidden Divergence?
Finding hidden divergences can be tough, especially for beginners. However, platforms like TickTrader offer intuitive tools to aid traders in spotting both hidden and classic divergences across all timeframes. Two of the most popular hidden divergence indicators are MACD and RSI. To provide a comprehensive understanding, we'll explore examples using both.
Hidden Bullish Divergence with the MACD
A hidden bullish divergence with the MACD (Moving Average Convergence Divergence) is evident when the asset price creates a higher bottom, yet the MACD histogram or line depicts a lower bottom. This deviation suggests that, although the uptrend may resume.
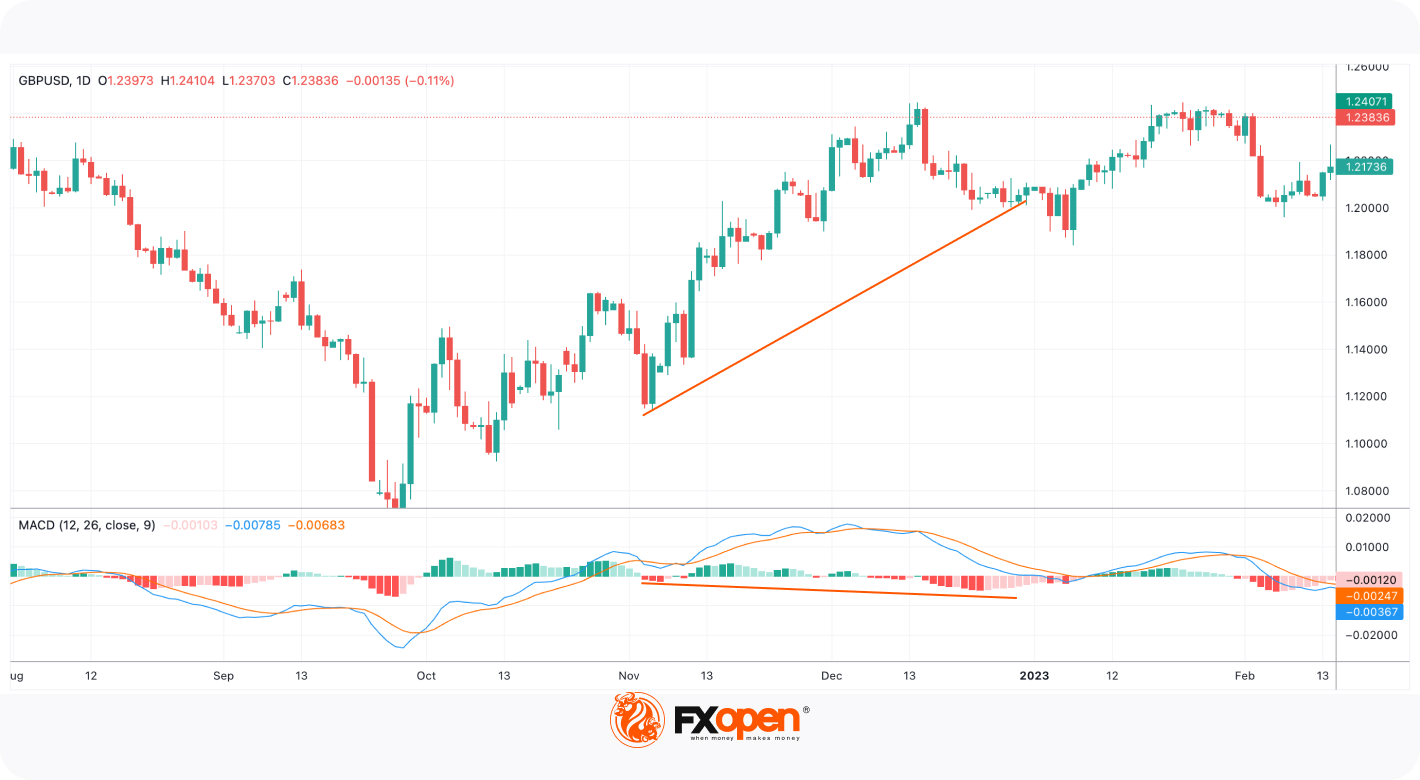
In the same way, you can spot a hidden bullish divergence with the RSI.
Hidden Bearish Divergence with the RSI
The bearish hidden divergence occurs when an asset's value reaches a lower peak while its oscillators form a higher peak and indicates a resumption of the downward trend.
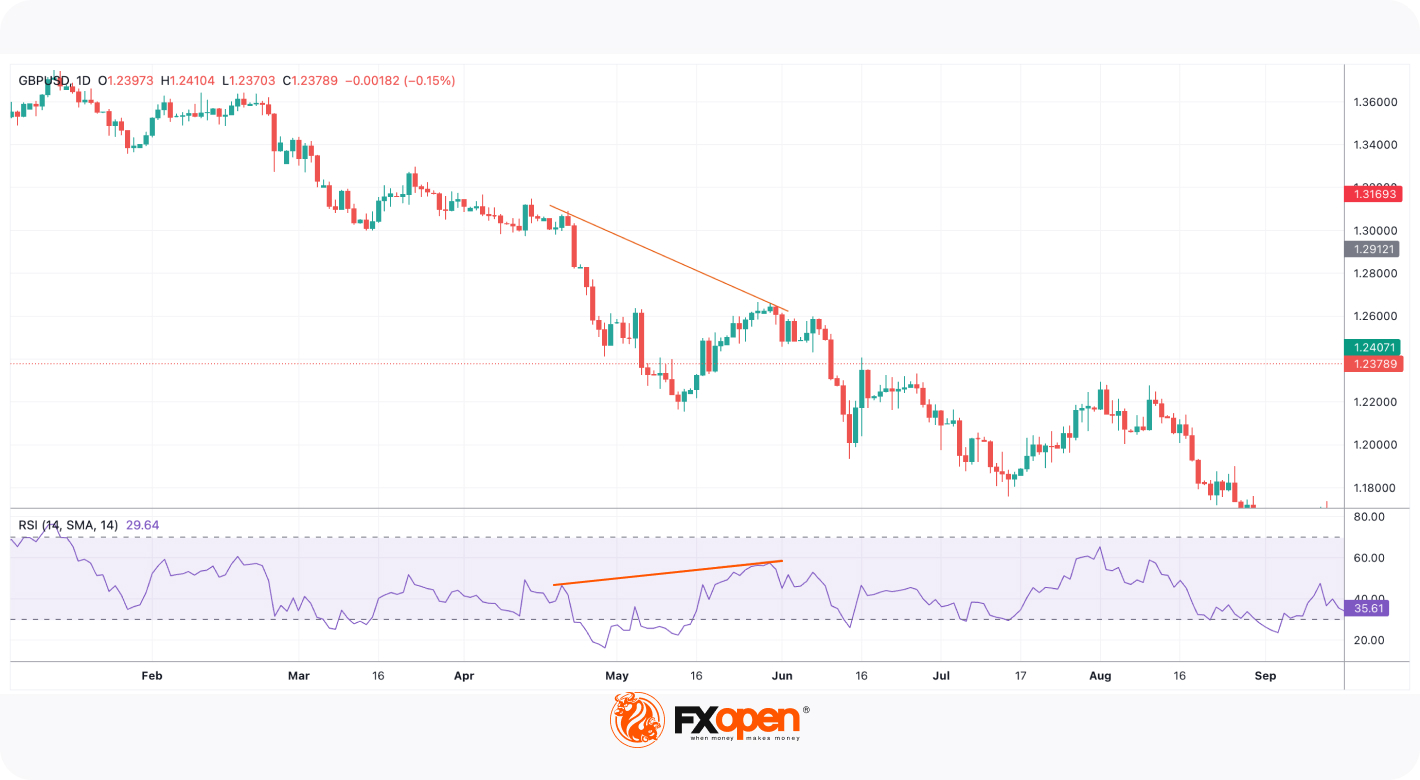
For instance, while the RSI was reaching a zenith on the chart, GBP/USD's price was descending to a trough. This highlighted the potential for further losses, and, as observed, GBP/USD's value diminished by approximately 12% in subsequent days.
Limitations of Hidden Divergence
-
Detection Difficulties:
- It can be subtle and not always immediately obvious.
- For those new to technical analysis, distinguishing between hidden and regular types can be challenging.
-
Real-time Analysis Challenges:
- In a live trading environment, rapid market movements can be misleading.
- Determining whether a market shift signifies the end of a consolidation period or is merely a short-lived anomaly requires keen observation and experience.
-
Emotional Biases:
- Emotional biases, such as fear or greed, greatly influence trading decisions.
- Succumbing to these biases may lead to misinterpreting signals from divergence indicators.
- Emotional trading often results in poor decision-making, leading to potential losses.
Conclusion
Divergences, both hidden and regular, provide traders with invaluable insights into potential market movements. They act as a lens, allowing for a clearer view of the undercurrents that drive price action. Ultimately, the mastery of hidden patterns – alongside a disciplined, objective approach to trading – paves the way for more informed decisions in the ever-evolving dance of the global markets.
With platforms like FXOpen offering a plethora of tools and resources, traders are better equipped than ever to navigate the intricate tapestry of global financial direction. Considering embarking on your trading journey? Learn more about how to open an FXOpen account today.
This article represents the opinion of the Companies operating under the FXOpen brand only. It is not to be construed as an offer, solicitation, or recommendation with respect to products and services provided by the Companies operating under the FXOpen brand, nor is it to be considered financial advice.
Stay ahead of the market!
Subscribe now to our mailing list and receive the latest market news and insights delivered directly to your inbox.


Latest articles

NZD/USD: Inflation Surge Meets Strong US Dollar Pressure
On 21 July, Stats NZ reported an acceleration in inflation: the Consumer Price Index rose 1.5% in the second quarter, while the annual inflation rate climbed to 4.1%, its highest level in more than two years and slightly

Weekly Market Insights with Gary Thomson: The Week of Central Banks and Earnings
In this video, we’ll explore the key economic events and market trends, shaping the financial landscape. Get ready for insights into financial markets to help you navigate the week ahead. Let’s dive in!
In this episode of Market

Intel at a Crossroads: Earnings Beat Meets Technical Resistance
Intel has just delivered its strongest quarter in over fifteen years, and the market reaction says it all. Q2 2026 revenue surged 25% year-over-year to $16.1 billion, crushing the consensus estimate of $14.42 billion, while adjusted EPS of