


Inverted Cup and Handle Pattern Explained
FXOpen
The inverted cup and handle is a bearish chart pattern that may signal a potential price decline. It is also called the reverse cup and handle or inverse cup and handle. The shape consists of a rounded inverted U followed by a small upward retracement known as the handle.
This pattern can appear in forex, stock, commodity, and CFD markets, often during a weakening uptrend. A confirmed break below the handle's lower boundary typically completes the formation and points to growing bearish pressure. The article covers identification, market psychology, common pitfalls, and trading considerations.
Inverted Cup and Handle Pattern Definition
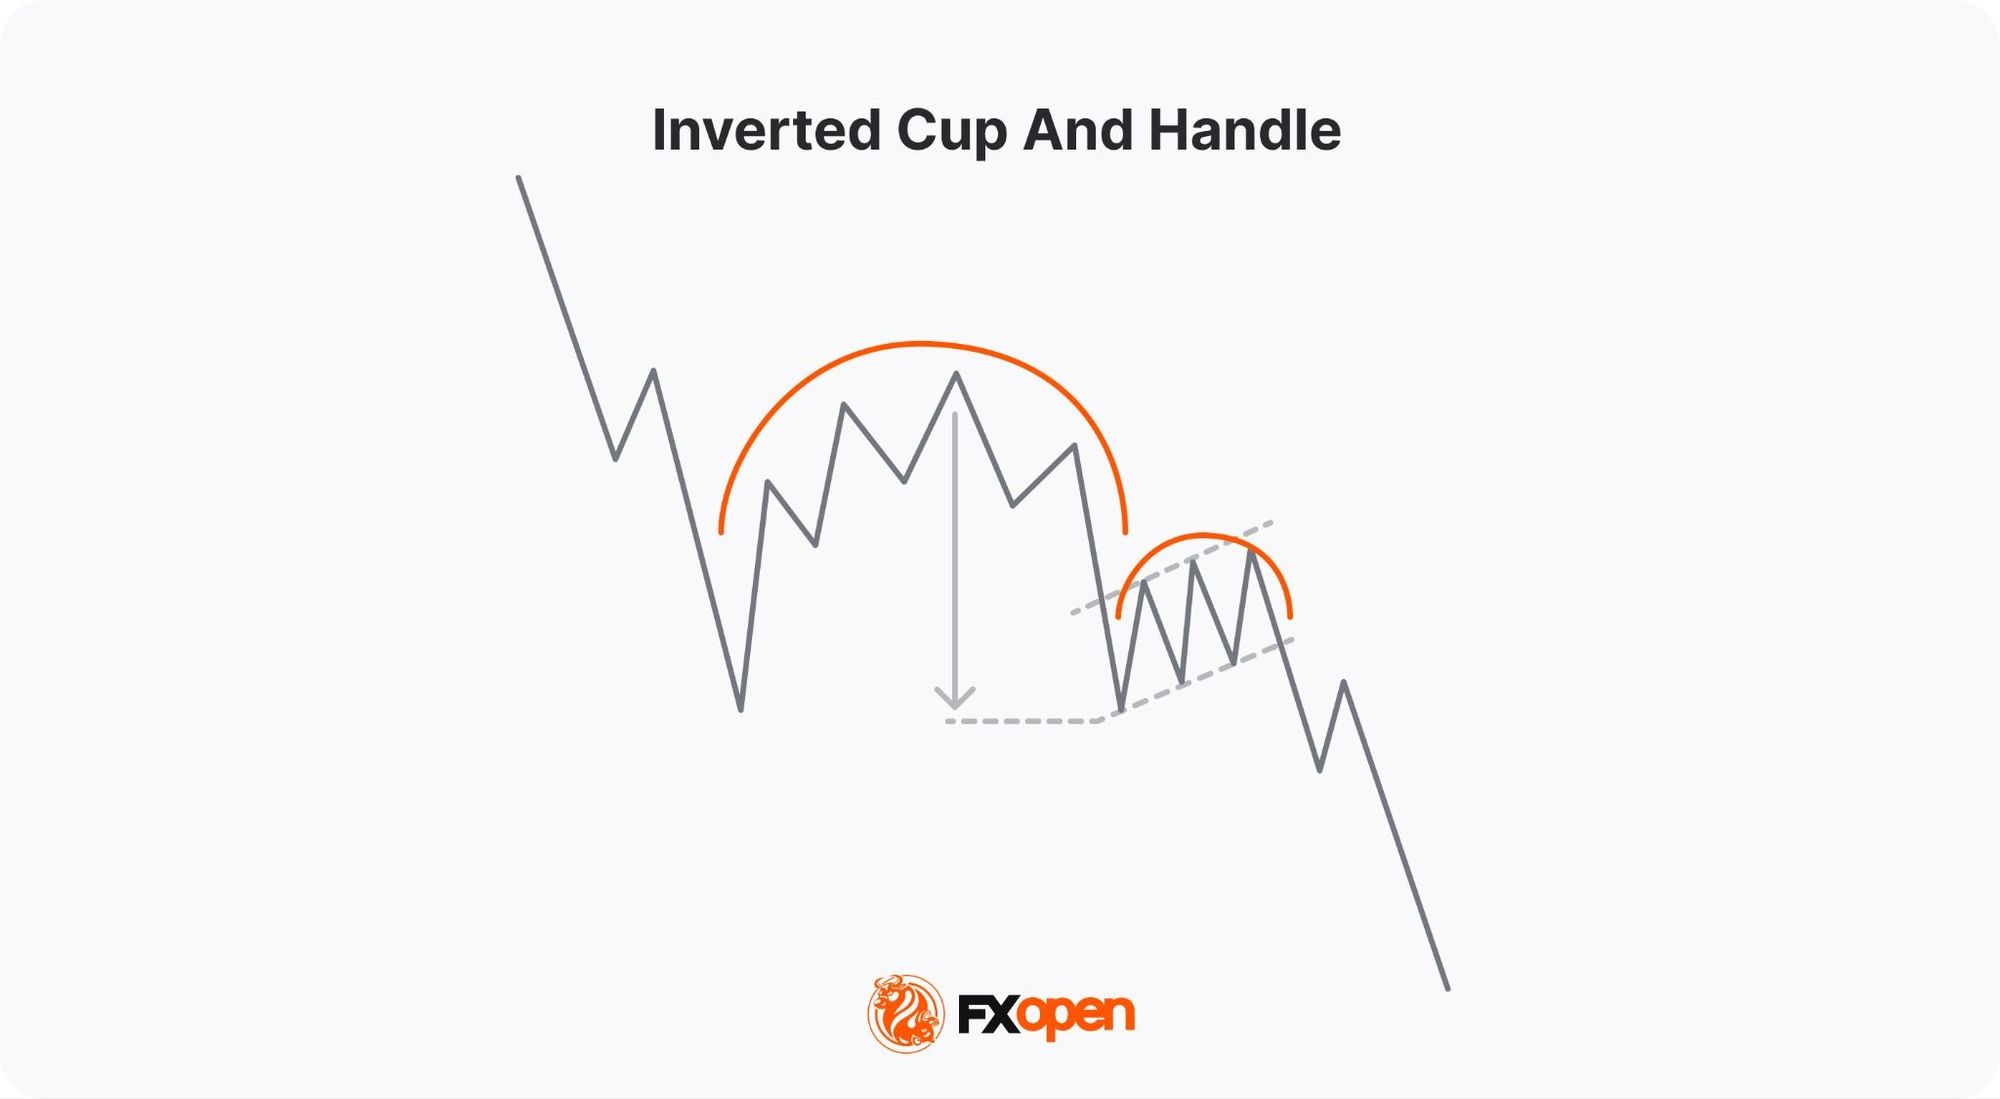
The inverted cup and handle, sometimes called an upside-down cup and handle pattern, is a bearish chart pattern that may appear during up- and downtrends. It is the opposite of the traditional cup and handle pattern, which is bullish. The inverse formation consists of three main parts: the "cup," which is an inverted U-shape, and the "handle," a small upward retracement following the cup, and a breakdown.
The pattern is the structural opposite of the cup and handle, which is a bullish chart formation. While the standard version signals a likely continuation of an uptrend, the inverted version points to potential weakness and a possible move lower once the neckline gives way. The pattern is recognised across many different asset classes and may appear on intraday, daily, and weekly charts.
Pattern Structure and Key Components
The inverse cup and handle pattern is built from three components — the cup, the handle, and the breakout — that develop in sequence. Typical rules are that the cup forms over a longer period than the handle (often a 3:1 to 5:1 duration ratio) and that the handle retraces no more than 50% of the cup's depth. Below, we’ll cover how to identify the reverse cup and handle pattern.
Cup Formation Characteristics
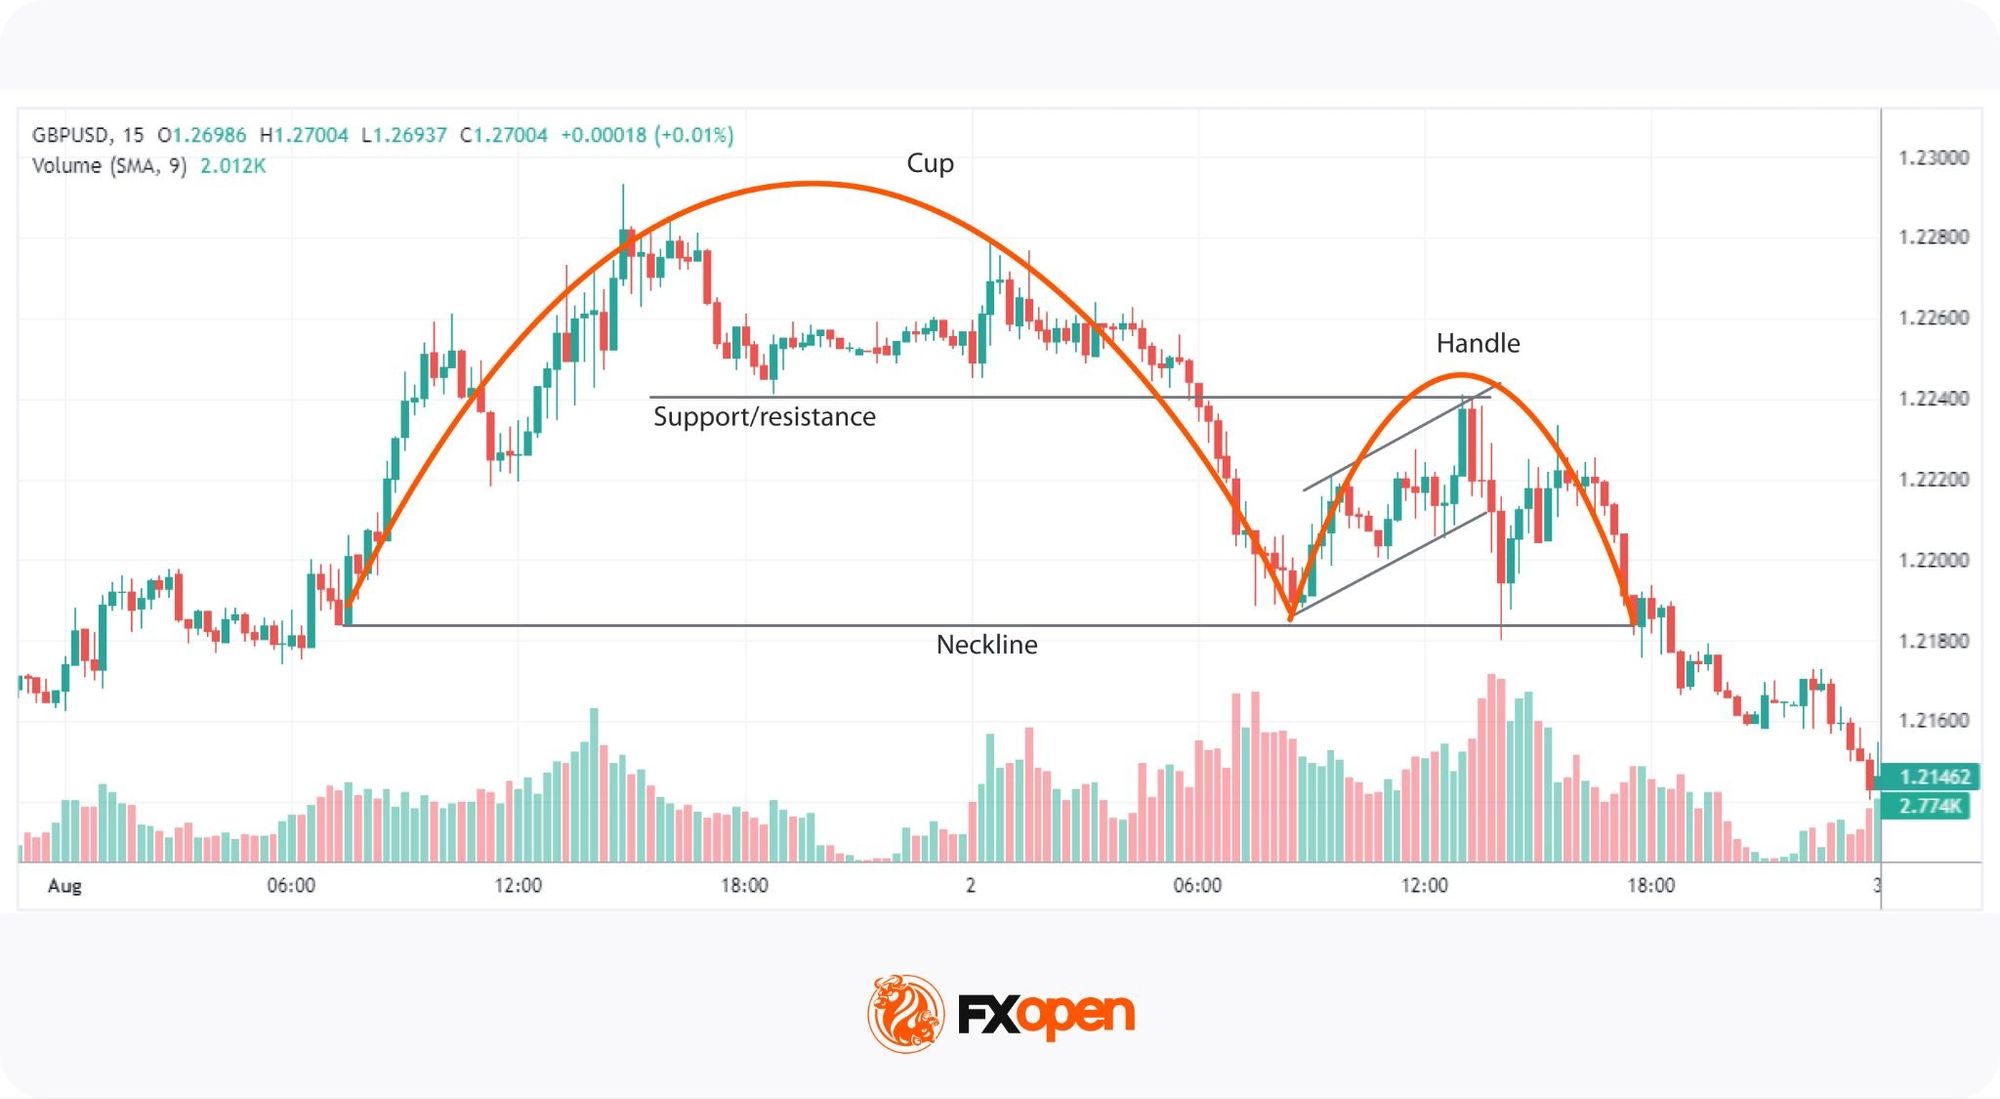
The cup begins with a gradual rise that flattens, consolidates, and then declines, forming an inverted U-shape. The top should be rounded rather than a sharp V, reflecting a gradual shift from buyers to sellers. Price action often shows narrowing volatility as the cup tops out, with the peak acting as a developing resistance level that sellers begin to defend on subsequent tests.
Handle Formation Rules
After the cup, prices retrace upwards to form the handle. An ideal handle pulls back no more than half the cup's depth and remains shorter in duration than the cup itself. The slope is usually slightly upward or sideways, and the handle often consolidates as a small flag or pennant before the eventual breakdown below the neckline.
Breakout and Confirmation Signals
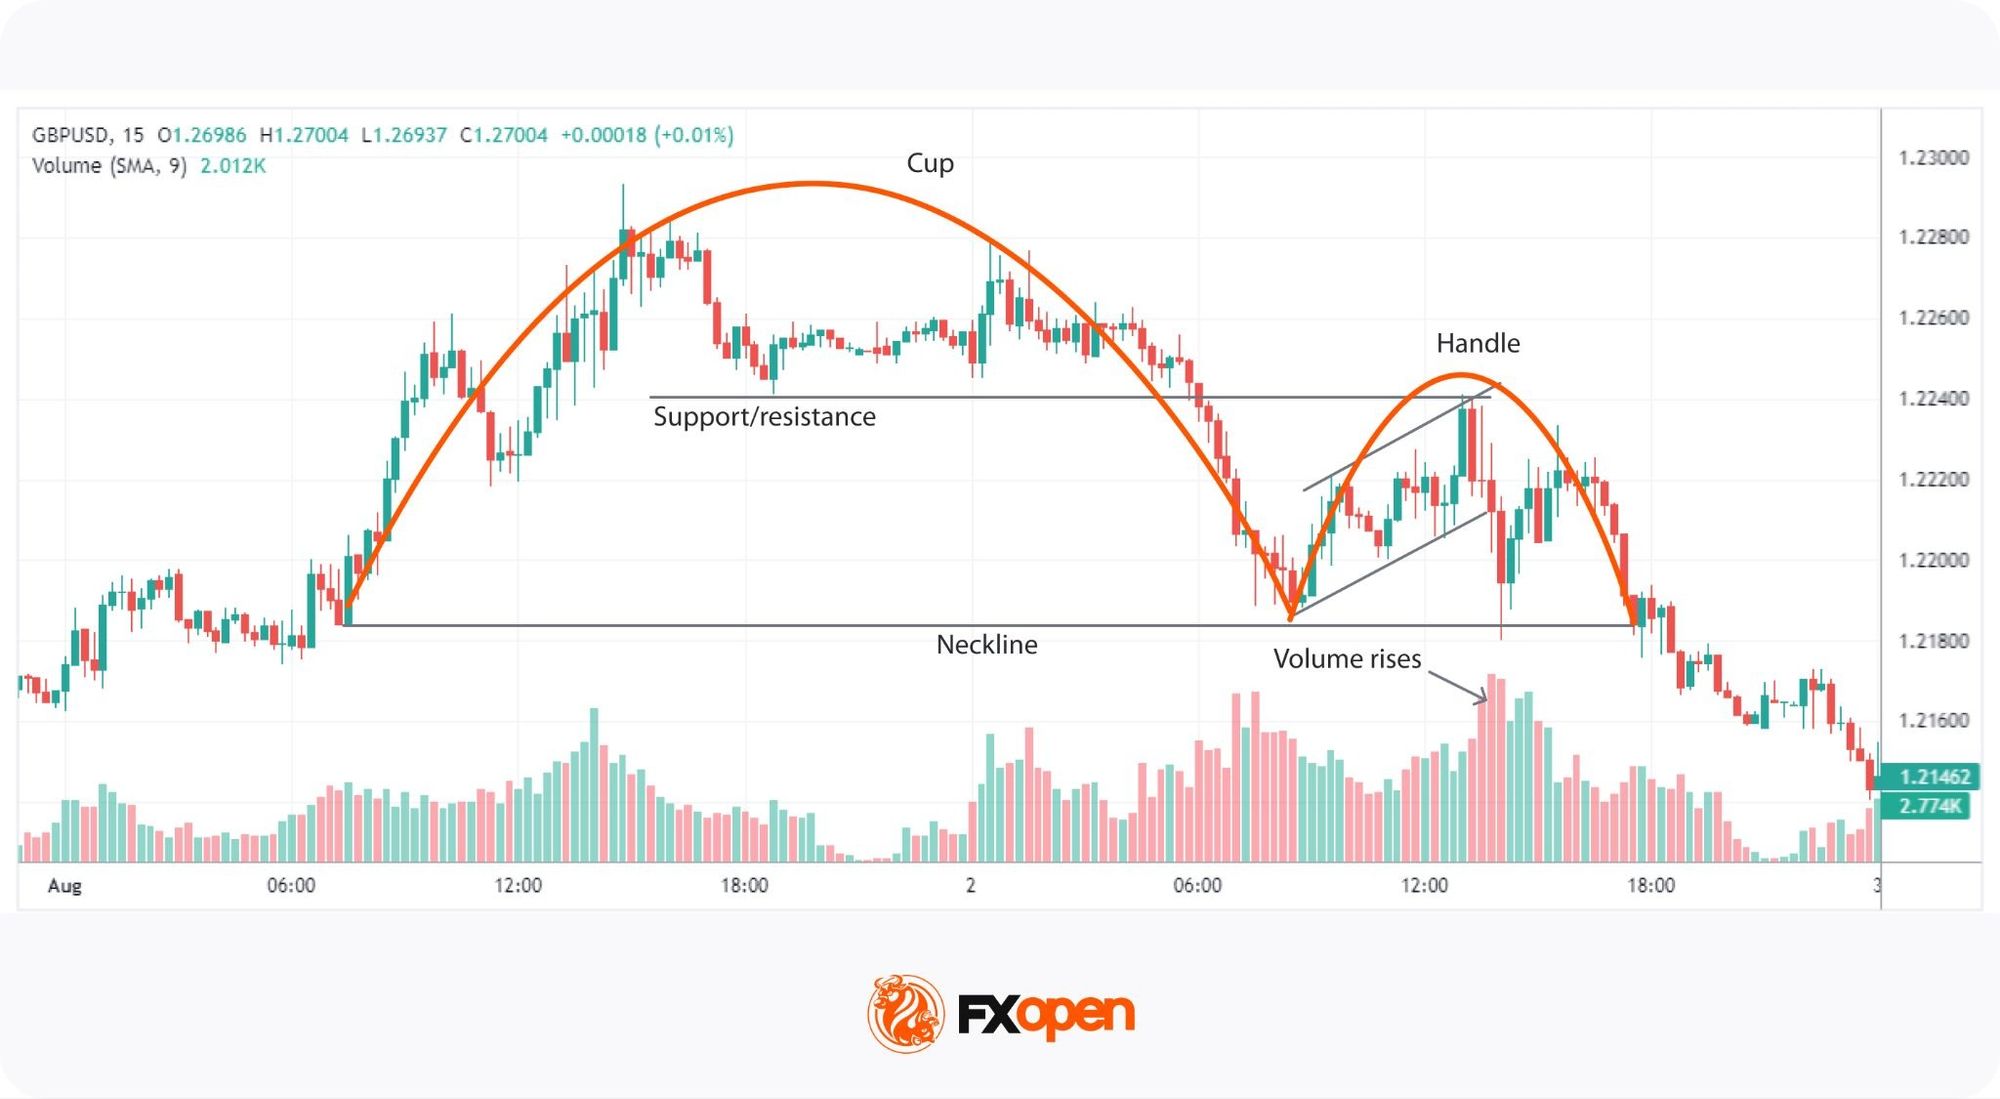
The pattern is confirmed when prices break below the neckline (a line drawn through the two pivotal low points that frame the handle), ideally with a decisive bearish candle close and a notable increase in volume. Volume typically thins during the cup and handle and expands on the breakout, which may help validate the move. Prices sometimes retest the broken neckline as new resistance before continuing lower. Without these confirmations, false breakouts remain a risk, especially on lower timeframes.
Market Psychology Behind the Pattern
The psychology of the reverse cup and handle pattern reflects a gradual shift from optimism to caution and then to outright bearish conviction.
The formation begins with a bullish strength, where demand drives prices higher. As the cup tops out, buyers thin out, profit-taking accelerates, and buying pressure weakens against firm overhead resistance. The rounded decline signals that conviction is fading rather than collapsing in a single move.
The handle is a brief upward retracement that often traps optimistic buyers expecting the uptrend to resume. It can act as a dead cat bounce, with liquidity drying up on the way up and re-emerging on the sell side. A break below the neckline tends to confirm the shift, with the volume surge reflecting sellers taking control and stranded buyers cutting positions.
Inverted Cup and Handle Breakout Strategy: Trading Considerations
Trading the inverted cup and handle pattern involves careful identification and strategic decision-making to maximise its potential. This pattern presents two primary entry points for traders: during the handle formation or after the neckline break.
Entry Before Neckline Break
- Conditions for Early Entry: Traders sometimes enter once the handle's lower boundary breaks rather than waiting for the neckline. This typically requires a clearly defined handle, declining momentum on the upward retracement, and confirmation from a bearish candle close below the handle's support.
- Technical Tools: Some traders use a medium-term moving average, such as a 21-period setting, to track the downward leg, along with momentum indicators like the RSI or stochastic oscillator. Bearish divergence on these tools can support the case for continued downside.
- Risk Considerations: Early entries offer a potentially stronger risk-to-reward profile but carry a higher chance of being caught in a false breakdown.
- Stop Loss and Take Profit: According to theory, stop losses are placed above the handle's high, and the inverse cup and take-profit target is measured by projecting the cup's depth downward from the entry point.
Entry After Breakout
- Confirmation Advantage: Waiting for the neckline break offers stronger confirmation of the formation but may provide a less favourable risk-to-reward ratio.
- Price Action: A decisive close below the pattern's low,with a strong candlestick and minimal wicks is believed to be a stronger breakout signal.
- Retest Entry: Some traders wait for prices to retest the broken neckline as new resistance, then enter on rejection. This may filter out shallow false breakdowns at the cost of a delayed entry.
- Volatility Filter: Comparing current volatility against the average true range or recent session ranges may help traders avoid entries during compressed conditions, where breakdowns are more prone to fail.
- Stop Loss and Take Profit: Stop losses are typically set above the handle's high. The inverted cup and handle target calculation remains based on the cup's height projected downward from the breakout point.
Common Errors
When trading the inverted cup and handle reversal pattern, several issues come up repeatedly:
- Premature Entry: Entering a trade too early, before the handle completes or the neckline breaks, can lead to false signals and losses. Most traders wait for clear confirmation, such as a decisive close below the neckline with increased volume.
- Ignoring Volume: Volume is a critical component in confirming the pattern. Low volume during the breakout phase may indicate a fakeout.
- Incorrect Pattern Identification: Misidentifying the pattern is a common error. The cup should have a rounded bottom, not a sharp V-shape, and the handle should be relatively short.
- Overlooking Market Conditions: External factors, such as news events or broader market trends, can impact the pattern’s reliability.
- Overfitting Indicators: Stacking multiple indicators until they all align before entry tends to delay decisions and curve-fit past data. A small set of complementary tools is often more practical than a crowded chart.
Advantages and Limitations
Like any chart pattern in trading CFDs and forex, the bearish cup and handle offers a structured read on price action while still being subject to the probability-driven nature of technical analysis. Outcomes vary, and confirmation is never guaranteed.
Advantages
- Defined Structure: The pattern provides clear reference points for analysing potential bearish moves, including the neckline, handle high, and projected target.
- Risk Framework: With the handle's high acting as a logical stop level and the cup's depth as a measured target, the pattern may support clearer risk planning.
- Versatility: The setup can be applied to forex and CFDs, and works across intraday and higher timeframes.
Disadvantages
- Identification Difficulty: The pattern is open to interpretation, and traders often disagree on whether a given structure qualifies. Experience helps, but subjectivity remains.
- Rarity: The pattern doesn’t occur frequently.
- False Breakouts: Like all chart patterns, it is susceptible to false breakouts, especially if not confirmed with volume and other technical indicators.
Key Takeaways
The inverted cup and handle is a bearish formation made up of a rounded inverted U, a small upward retracement, and a breakdown below the neckline. Confirmation typically comes from a decisive close below the neckline, supporting volume behaviour, and alignment with broader market conditions.
Want to put this and other patterns to the test on live charts? You can consider opening a forex trading account with FXOpen and access the TickTrader platform to trade 700+ markets.
FAQ
What Is the Inverse Cup and Handle Pattern in Forex?
The inverted cup and handle in forex is a bearish chart pattern. It features an inverted U-shaped cup followed by a small upward retracement (the handle). This pattern suggests that sellers are gaining control, and prices are likely to decline further once the neckline is broken.
How Can You Trade the Inverse Cup and Handle?
Traders often enter positions either on the break of the handle’s lower boundary or after the neckline break. Entering during the handle might offer a stronger risk-to-reward ratio, while waiting for the neckline break could provide stronger confirmation.
What Happens After the Reverse Cup and Handle Pattern?
After the reverse cup and handle pattern is completed, the price typically moves downward strongly. This bearish movement is often confirmed by a strong breakout below the neckline or handle with increased volume, signalling a sustained decline in prices.
What Is the Opposite of the Cup and Handle?
The opposite of a cup and handle is the inverse cup and handle pattern. While the cup and handle indicates a bullish movement, the inverse version signals a bearish trend.
Is the Inverted Cup and Handle Bullish or Bearish?
The inverted cup and handle pattern is bearish. It indicates that the price will move downwards, suggesting that traders may open short trades.
What Indicators Are Commonly Used With the Inverted Cup and Handle Pattern?
Traders often combine the inverted cup and handle with the RSI or stochastic oscillator for momentum, moving averages for trend context, and volume analysis to validate the neckline break. No single cup and handle reversal pattern indicator confirms the setup, so traders typically look for confluence across two or three tools.
This article represents the opinion of the Companies operating under the FXOpen brand only. It is not to be construed as an offer, solicitation, or recommendation with respect to products and services provided by the Companies operating under the FXOpen brand, nor is it to be considered financial advice.
Stay ahead of the market!
Subscribe now to our mailing list and receive the latest market news and insights delivered directly to your inbox.


Latest articles

GBP/CHF: Trendline or RSI — Which One Is Lying?
Sterling enters this week on firmer footing, with political uncertainty fading fast after Andy Burnham's confirmation as Labour leader eased investor concerns over the succession to Keir Starmer. Markets reacted further to reports pointing to Shabana Mahmood as the frontrunner

Silver Attempts to Break Out of Its Range
Silver continues to balance between its dual role as an industrial metal and so-called refuge asset, and this combination largely explains the lack of a clear trend in recent weeks. Shifting expectations for central bank interest rates can influence the

Nasdaq 100: Is This the Correction Traders Have Been Waiting For?
The Nasdaq 100 (US Tech 100 Mini on FXOpen) remains caught between two opposing forces: cooling inflation on one side, and persistent geopolitical instability on the other. On 14 July, June's CPI print came in softer than expected, easing near-term