


How to Trade with a Bearish Harami Pattern
FXOpen
The bearish harami is a two-candlestick pattern that highlights that the market is in for a possible reversal from an uptrend to a downtrend. It may benefit traders and technical analysts seeking to spot selling opportunities. This article will outline how to recognise this formation with various bearish harami examples on a price chart and then interpret its signals.
What Is a Bearish Harami Candle Pattern?
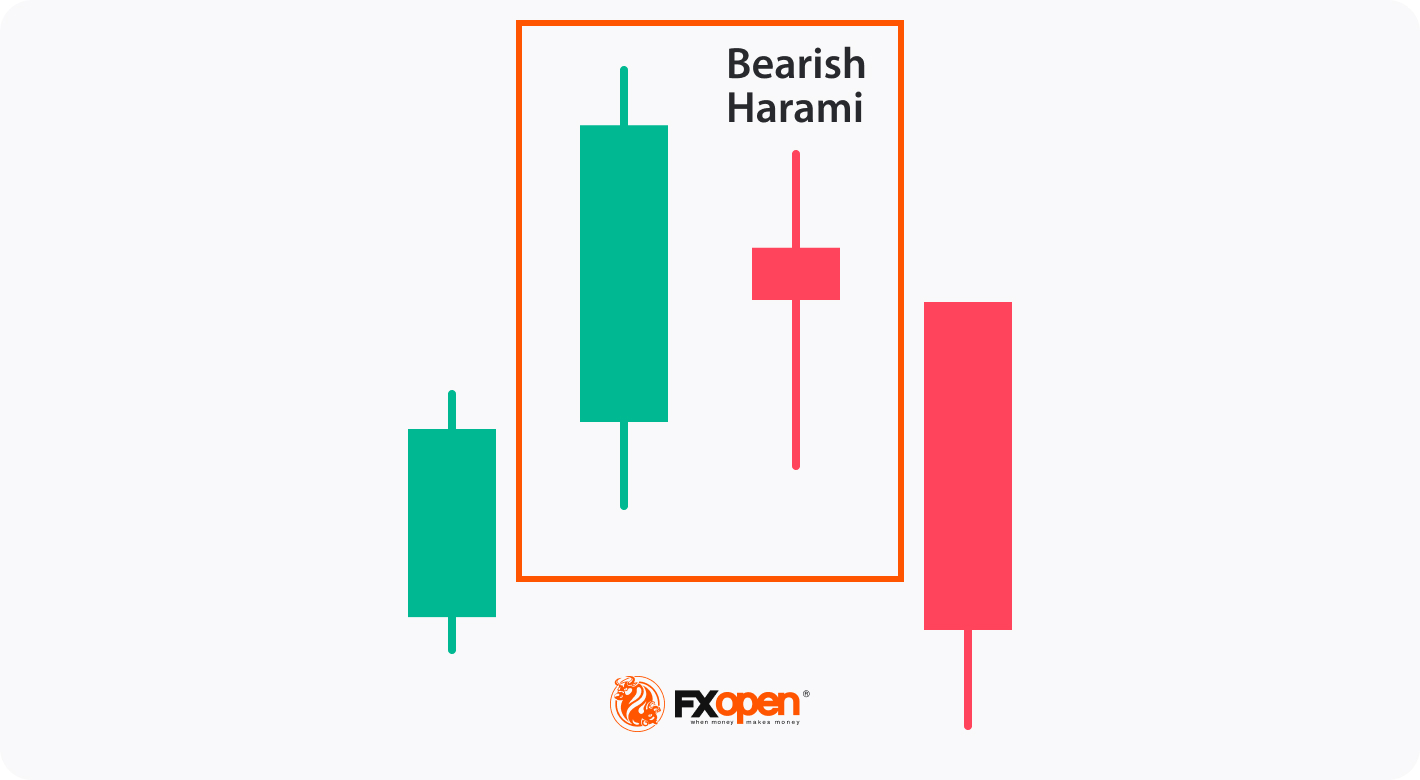
A bearish harami candlestick pattern is a technical analysis setup that consists of two candlesticks and predicts a potential reversal from an upward trend to a downward trend. The setup is formed when a large green bar is followed by a smaller bearish bar that is completely engulfed within its body. It signifies a potential shift in market sentiment, indicating that selling pressure may outweigh buying pressure in the near future.
The bearish harami candlestick formation is applicable to various financial instruments, including stocks, cryptocurrencies*, ETFs, indices, and forex, without any restriction on the timeframe. FXOpen enables market participants to trade these instruments through contracts for difference (CFDs).
Bullish Harami vs Bearish Harami
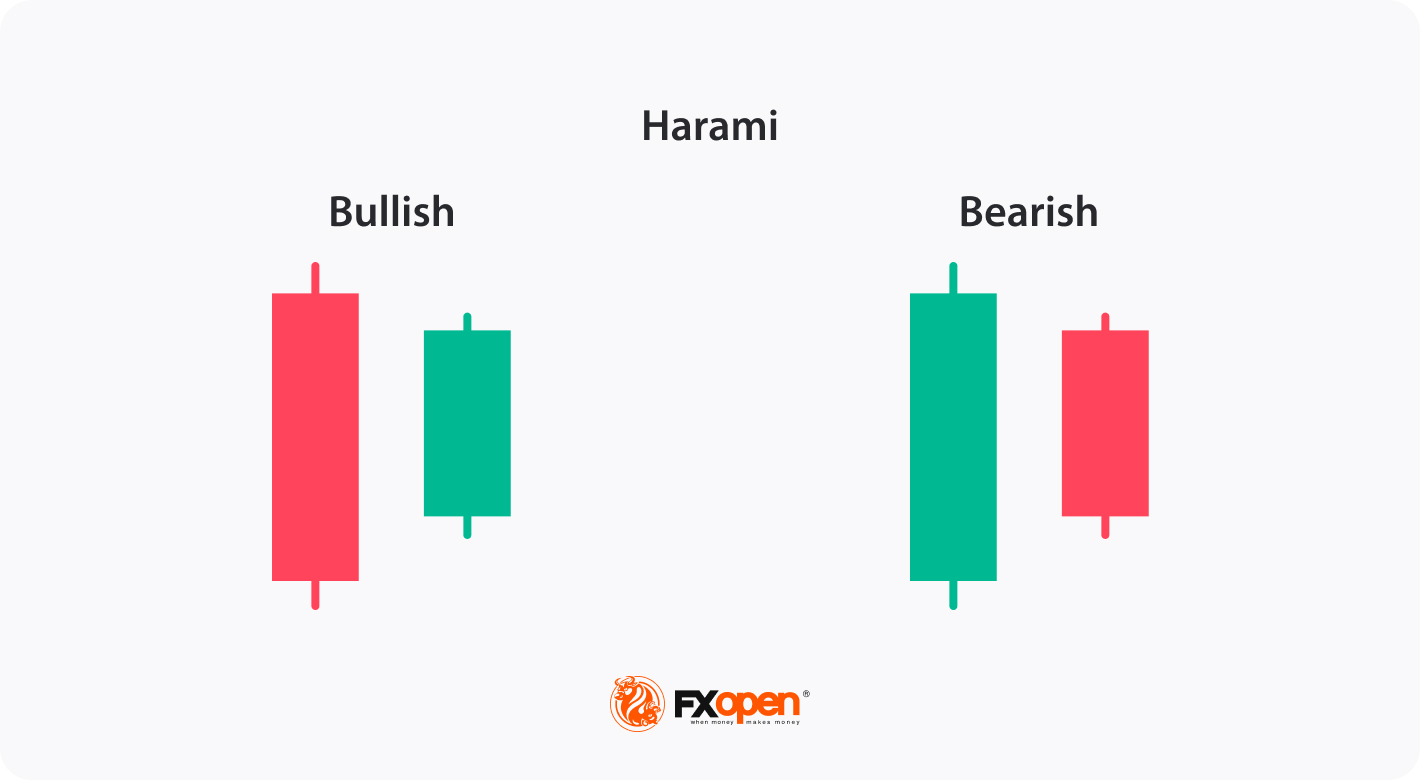
The bullish and bearish harami are two candlestick patterns used in technical analysis to identify potential trend reversals. The bullish harami consists of a large bearish candlestick followed by a smaller green candlestick, signalling a possible reversal from a downtrend to an uptrend. On the other hand, the bearish harami comprises a large green bar followed by a smaller bearish bar, indicating a potential reversal from an uptrend to a downtrend. Traders and analysts use these patterns to identify buying or selling opportunities based on the anticipated shift in market sentiment.
Traders can analyse bearish and bullish harami formations on charts of different assets and in different timeframes for free using the FXOpen TickTrader platform.
Identifying a Bearish Harami on Trading Charts
To identify the bearish harami on trading charts, traders follow these steps:
- Look for an existing uptrend: Before spotting a bearish harami on forex, stocks, commodities, and other financial instruments, it's important to identify a prevailing uptrend. The stronger the uptrend, the more reliable the signal.
- Look for bearish and bullish candles: The harami consists of two candlesticks. The first candle should be large and bullish, indicating buying pressure; the second one should be smaller and bearish, with its body fully contained within the body of the preceding candle.
- Analyse the formation: The setup signifies a potential reversal of the uptrend. It suggests that selling pressure may be gaining strength and that it could lead to a downtrend. Traders pay attention to the size and shape of the candlesticks, focusing on the contrast between the bearish and bullish candles.
Trading the Bearish Harami Candlestick Pattern
When trading the formation, traders typically implement their strategies based on the following general rules:
- Entry: Traders may initiate a short position once they identify a setup on a chart. However, it is crucial to wait for bearish harami confirmation before entering the trade. Validation can be in the form of the next bearish candle after the pattern or a break below a support level. An early entry can increase the risk of false signals.
- Take Profit: To determine a take-profit level, traders often look for potential support levels. They analyse previous price action or employ technical analysis tools like trendlines or moving averages to identify them.
- Stop Loss: Implementing a stop-loss order is vital for risk management. Traders may place their stop-loss orders above the high of the green candle in the setup. This helps mitigate potential losses if the trade goes against expectations.
Live Market Example
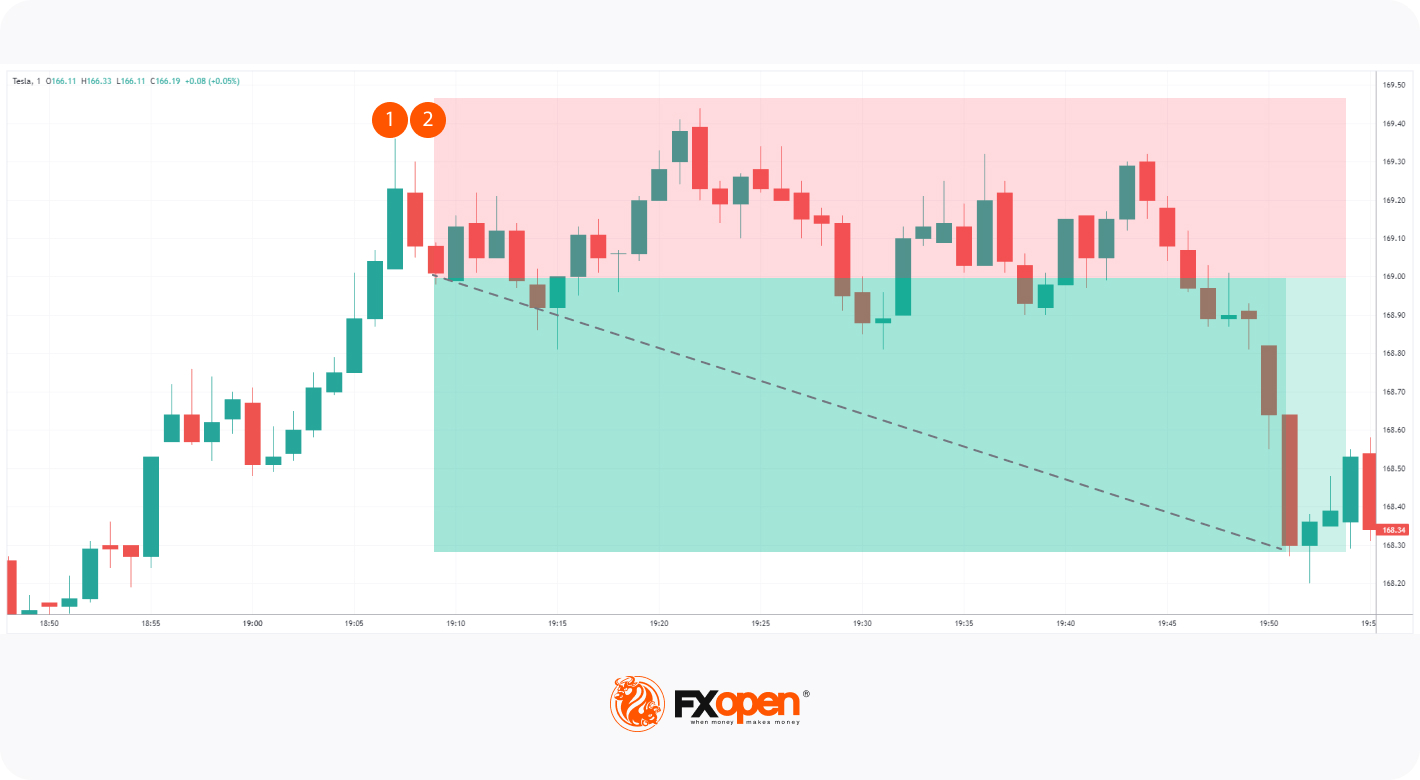
The bearish harami chart shows the setup on the chart of Tesla’s stocks. After it was formed, the trader could have waited for another red candle to break below the initial bullish bar. The take-profit target could have been set at the closest support level. However, trading the bearish harami following the guidelines could have led to an early exit as the price rose significantly before the downtrend formed. If a trader calculated the stop-loss level based on the risk/reward ratio, they would have placed the stop loss much higher above the recent swing high.
Final Thoughts
While the bearish harami formation can provide valuable insights into potential trend reversals, traders don’t rely solely on it as the basis for their trading decisions. Complementing the bearish harami image with technical indicators and implementing effective risk management strategies to mitigate potential losses is important.
Traders also exercise caution and remain aware of the possibility of false signals, adapting their trading strategies accordingly to improve their chances of achieving successful outcomes. Once you feel confident in your trading approach, you can open an FXOpen account to apply your method to live trading.
FAQ
What is a bearish harami candle pattern?
It is a two-candlestick formation on a price chart that indicates a potential reversal from an uptrend to a downtrend. It consists of a large green candle followed by a smaller red candlestick completely contained within the range of the preceding bullish candle. It suggests a weakening of buying pressure and a possible shift in market sentiment towards selling.
Is the bearish harami reliable?
The reliability of the setup, like any other technical analysis tool, is not absolute and can vary. While the formation indicates a potential trend reversal, it is important to consider other factors and confirmatory signals for validation. Traders often incorporate additional technical indicators, price patterns, and fundamental analysis to increase the reliability of their trading decisions. It is crucial to exercise caution, manage risk effectively, and combine the formation with other forms of analysis to make informed trading decisions.
Is harami bearish or bullish?
Depending on its specific formation, the harami formation can be either bearish or bullish. The meaning of bearish harami is buried in its name. The setup occurs during an uptrend before a trend reversal and consists of a large bullish candlestick followed by a smaller red one that is completely engulfed within the body of the preceding green candle. On the other hand, a bullish harami pattern occurs during a downtrend and signals a trend change. It consists of a large red bar followed by a smaller green bar that is fully contained within its body.
What does a harami candle indicate?
The harami candle pattern, which can be either bearish or bullish, provides information about potential trend reversals. It suggests a possible shift in market sentiment and can indicate either a momentary pause or consolidation in the price movement or a trend reversal.
*At FXOpen UK and FXOpen AU, Cryptocurrency CFDs are only available for trading by those clients categorised as Professional clients under FCA Rules and Professional clients under ASIC Rules, respectively. They are not available for trading by Retail clients.
This article represents the opinion of the Companies operating under the FXOpen brand only. It is not to be construed as an offer, solicitation, or recommendation with respect to products and services provided by the Companies operating under the FXOpen brand, nor is it to be considered financial advice.
Stay ahead of the market!
Subscribe now to our mailing list and receive the latest market news and insights delivered directly to your inbox.


Latest articles

EUR/USD: All Eyes on the Fed as the Range Reaches Its Breaking Point
The dollar's next move hinges on tonight's Fed decision, and this time markets genuinely don't know what to expect. While economists still lean toward a hold—with CME FedWatch odds sitting near 68.5% for no change—Kevin Warsh's hawkish

USD/JPY and USD/CAD Test Resistance Ahead of Fresh Fed Signals
The US dollar continues to hold the upper hand against most major currencies ahead of the outcome of the latest Federal Reserve meeting. While the base-case scenario remains for interest rates to stay unchanged, markets are also pricing in the

Amazon Earnings: Does the Chart Already Know Something the Numbers Don't?
All eyes are on July 30, when Amazon reports Q2 2026 earnings, with Wall Street increasingly convinced the bar has been set too low. Consensus sees EPS near $1.82-$2.26 on roughly $197 billion in revenue, but the