


How to Trade with a Bearish Rectangle Chart Pattern
FXOpen

A bearish rectangle is a chart pattern that is commonly considered by analysts and traders. It shows an intense battle between buyers and sellers in a prevailing downtrend. Knowing its intricacies can be helpful for unlocking valuable insights into market conditions. Keep reading this FXOpen article to learn how to trade with the bearish rectangle.
What Is a Bearish Rectangle Chart Pattern?
A bearish or descending rectangle pattern is commonly observed in technical analysis. It is characterised by a formation of two horizontal parallel trendlines, one serving as resistance while the other acts as support. It generally appears when a period of consolidation is sustained in a downward trend or sideways trading.
How to Identify a Bearish Rectangle
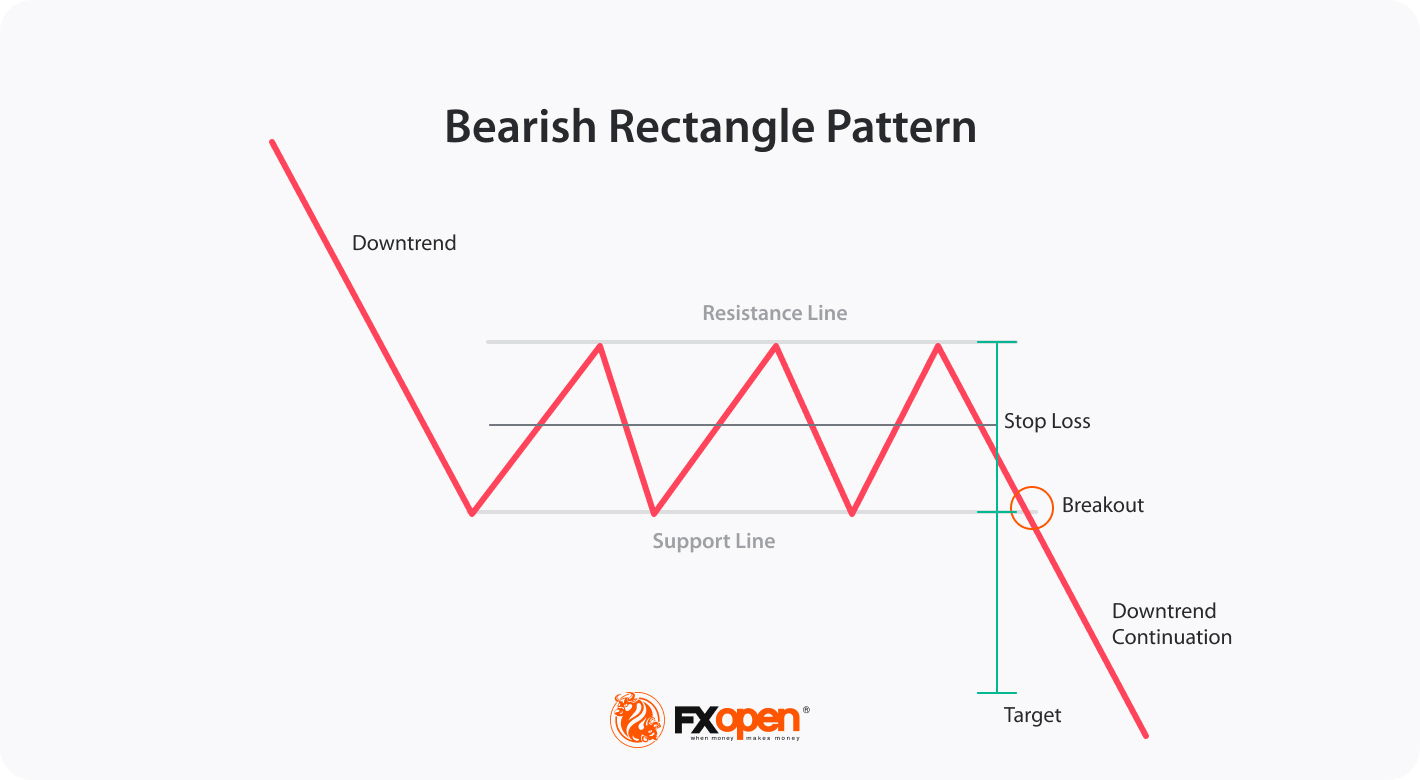
To spot the bearish rectangle on a price chart, traders connect the highs and lows of consolidating prices with straight horizontal lines in a downtrend. You have a confirmed bearish rectangle formation if these two lines are parallel. The upper boundary serves as the resistance, while the lower boundary is considered the support. Asset prices oscillate between these drawn trendlines, showing no momentum or clear trend direction. Still, the pattern implies that sellers are in control, preventing prices from making a significant upward movement as it indicates a likely downward breakout and continuation of an established downtrend.
Bearish Rectangle vs Bullish Rectangle Pattern
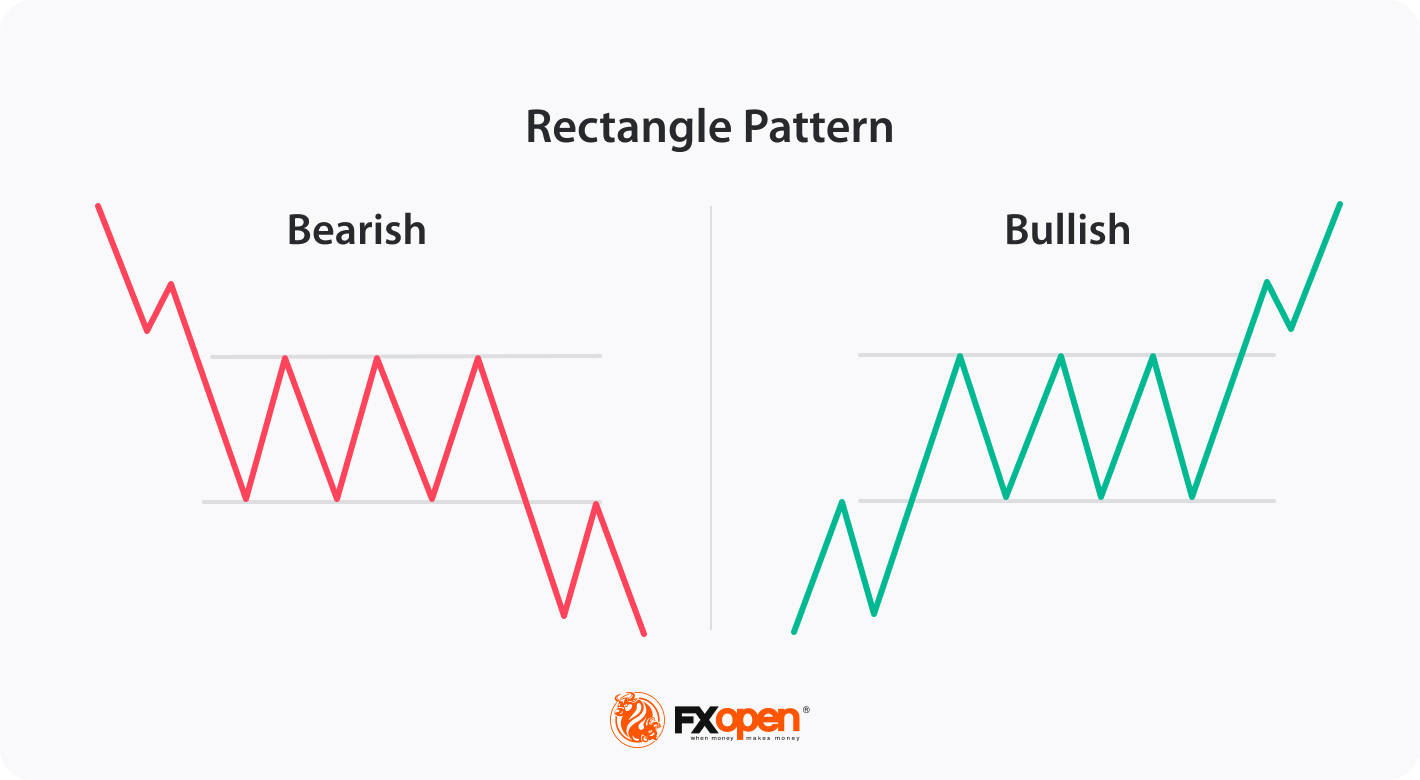
The bearish and bullish rectangles are two opposite formations in technical analysis. A major difference between these shapes is their prevailing trend and the direction of an eventual breakout. While the bearish formation occurs in a downtrend and may be confirmed by a downside breakout, the bullish alternative occurs in an uptrend and gets confirmed with an eventual upside or resistance breakout.
While patterns have similar shapes, it can be seen that they indicate different things. Therefore, it’s essential to practise before implementing them into your trading strategy. The TickTrader trading platform allows traders to learn how to spot patterns on charts of different assets and trade them right away.
How to Trade the Bearish Rectangle in a Downtrend
The bearish rectangle is a continuation pattern; this means it predicts a potential continuation of a downtrend. The theory states that a bearish pattern can be traded in the following steps:
Entry
Traders enter a sell trade after identifying a descending pattern alongside prices oscillating within the same highs and lows together with a breakout below the support line.
Profit Target
With bearish rectangle trades, there’s a rule about setting the minimum target – traders can stay in a trade for a price move that equals the distance between the support and resistance levels, starting from the breakout point. This is the minimum target.
Stop Loss
It’s generally advisable to secure a trade, which involves managing your position with a stop loss and not leaving it to chance. To get a suitable stop-loss level, traders can measure the distance between parallel support and resistance lines and divide it by 2. The midpoint will be a stop-loss level. This will allow you to trade with a win-loss ratio of 2:1.
However, if you enter a trade a few candles after a breakout, such an approach may increase your risk/reward ratio. Therefore, you can identify a stop-loss level considering the take-profit target and place it just below the lower line of the rectangle.
Live Example
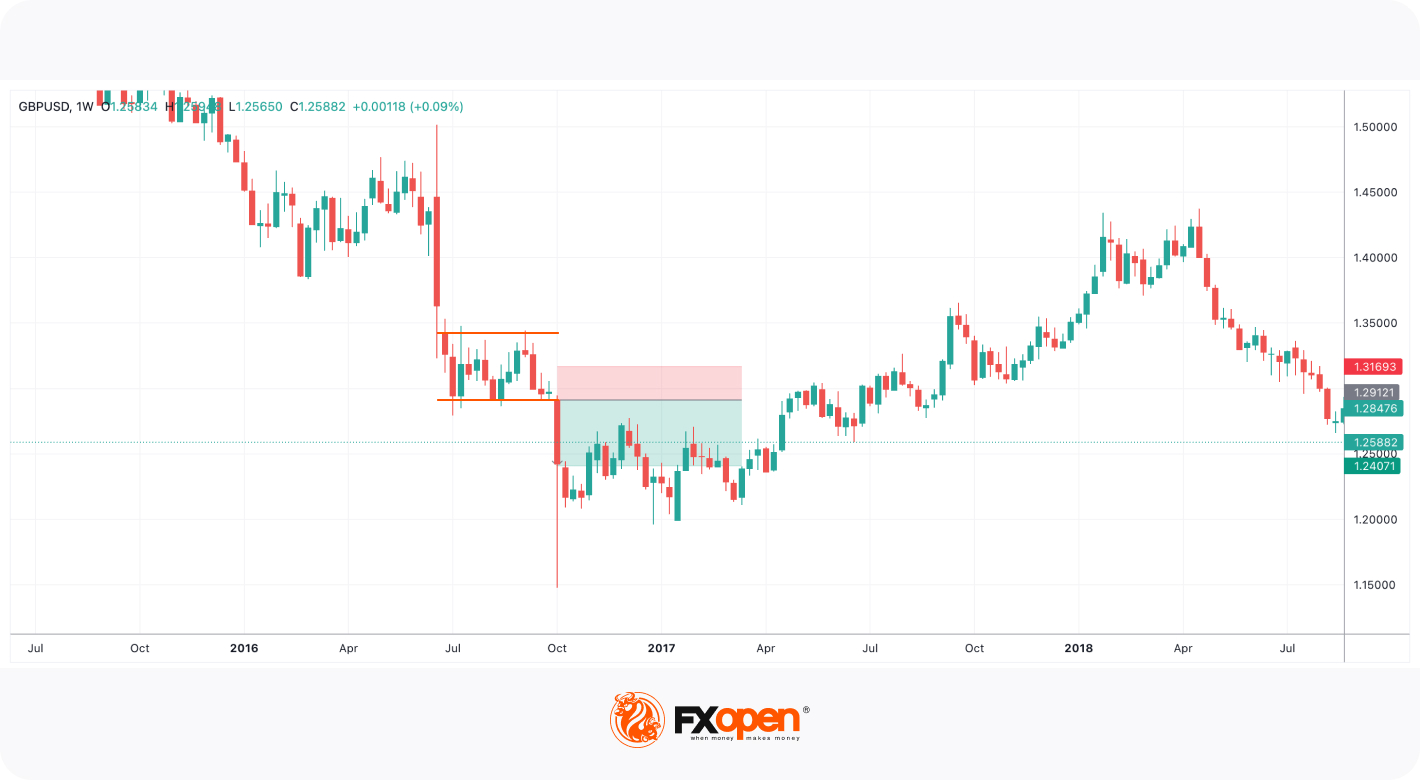
In the chart above, you can identify the bearish rectangle formed due to a pause in a downtrend. After drawing the support and resistance lines, you could enter the trade at the point where the price breaks the support and continues moving in a downward trend. You could set a stop loss at the midpoint of the distance between the borders of the rectangle and a profit target at a point that equals the distance between them. However, as you could notice, you would have missed a part of the profit relying on the common rule. Therefore, it was worth using a trailing take-profit order.
You can open an FXOpen account and adopt this formation to improve your trading approach.
Summary
Understanding the descending rectangle may help you make informed trading decisions as it provides insights into essential strategy parameters, such as stop loss and profit targets. Moreover, as it’s also a simple trading pattern, users with any level of knowledge can use it. A thorough analysis within a broader context of market conditions, confirmation using other technical tools, together with trend occurrence may further strengthen the validity of this formation.
FAQ
What is a bearish rectangle pattern?
The bearish rectangle is a chart pattern that forms when prices consolidate during a downtrend; it is shaped with support and resistance lines. The prevailing downtrend generally suggests further downward movement. When the price breaks below the support and the downtrend continues, you may consider entering a short position, setting a profit target at a distance equal to the width of the pattern and a stop loss at the pattern’s midpoint.
Is the rectangle pattern bearish or bullish?
The rectangle occurs on price charts when there is a pause in a trend and the price consolidates between resistance and support levels. It does not have a specific falling or rising bias, but it is considered bearish when it occurs in a downtrend and the price breaks the support barrier to continue a downward movement. In contrast, it is considered bullish when it is formed in an uptrend, and the price breaks the resistance line to continue moving upwards.
This article represents the opinion of the Companies operating under the FXOpen brand only. It is not to be construed as an offer, solicitation, or recommendation with respect to products and services provided by the Companies operating under the FXOpen brand, nor is it to be considered financial advice.
Stay ahead of the market!
Subscribe now to our mailing list and receive the latest market news and insights delivered directly to your inbox.


Latest articles

NZD/USD: Inflation Surge Meets Strong US Dollar Pressure
On 21 July, Stats NZ reported an acceleration in inflation: the Consumer Price Index rose 1.5% in the second quarter, while the annual inflation rate climbed to 4.1%, its highest level in more than two years and slightly

Weekly Market Insights with Gary Thomson: The Week of Central Banks and Earnings
In this video, we’ll explore the key economic events and market trends, shaping the financial landscape. Get ready for insights into financial markets to help you navigate the week ahead. Let’s dive in!
In this episode of Market

Intel at a Crossroads: Earnings Beat Meets Technical Resistance
Intel has just delivered its strongest quarter in over fifteen years, and the market reaction says it all. Q2 2026 revenue surged 25% year-over-year to $16.1 billion, crushing the consensus estimate of $14.42 billion, while adjusted EPS of