


A Dark Cloud Cover Candlestick Pattern: Meaning and Application
FXOpen
The dark cloud cover is a two-candlestick pattern that suggests a potential reversal from an uptrend to a downtrend. It may benefit traders and technical analysts seeking to identify selling opportunities. In this article, we will discuss how to spot the setup on a price chart and interpret its signals.
What Is a Dark Cloud Cover?
The dark cloud cover is a two-candlestick bearish pattern that signals a potential reversal in an uptrend. How to identify dark cloud cover? To recognise the pattern, traders look for specific characteristics that distinguish this formation on a chart.
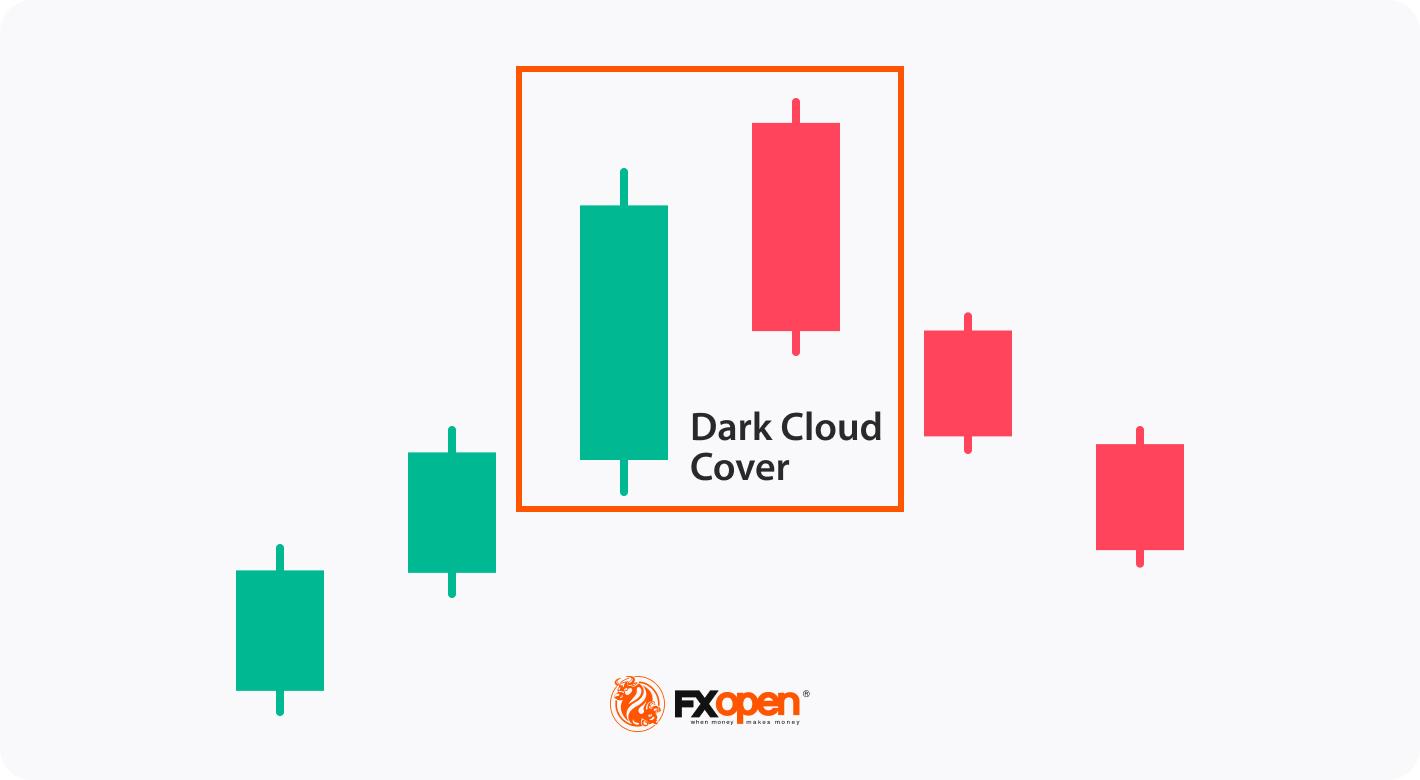
Key elements to identify include:
- Preceding Uptrend: The dark cloud cover candle pattern is typically observed after a clear and prolonged upward movement in price, setting the stage for a possible trend reversal. Its reliability increases when it occurs after a well-established uptrend.
- First Candlestick: The first candlestick in the pattern is bullish and long, reflecting the ongoing strength of buyers.
- Second Candlestick: The second candlestick is bearish, opening above the high of the first. The gap up at the opening, followed by a strong downward move, indicates a shift in market sentiment. This shift suggests that buyers have lost control, and sellers are gaining strength.
- Candlestick Body Relationship: The body of the second candle should overlap at least half of the first candle’s body, reinforcing the idea of a significant change in market sentiment.
These features collectively highlight a weakening of the uptrend and the emergence of bearish pressure, providing a potential signal for traders to anticipate a market reversal.
Traders often look for confirmation of this pattern with further bearish movement or technical indicators before making trading decisions. Recognising this formation can help anticipate potential downturns and manage risk in bullish markets.
Regardless of the timeframe, the pattern can be observed in any asset, such as currency pairs, stocks, cryptocurrencies*, indices, and commodities. However, the most common is a dark cloud cover in forex. At FXOpen, market participants can trade over 600 assets via CFDs with tight spreads and low commissions.
Trading the Dark Cloud Cover
Here are the steps you can use to trade this formation:
- In trending markets, traders look for an uptrend and identify if it's showing signs of slowing down or weakening. They then wait for a red bearish candle to gap above the previous green one, which opens mostly at the same level as the previous close.
- The bearish candle should move lower and close below the midway point of the bullish one, indicating that the bears outweigh the bulls. Although there are no specific trading rules, the theory states that traders can place a sell order at the opening of the next candle after the setup has formed or wait for a few candles to close lower to validate the bearish signal. The choice will depend on the trader’s risk tolerance and the timeframe. A stop-loss level is usually placed above the recent swing high.
- Traders can set their initial target at key support levels.
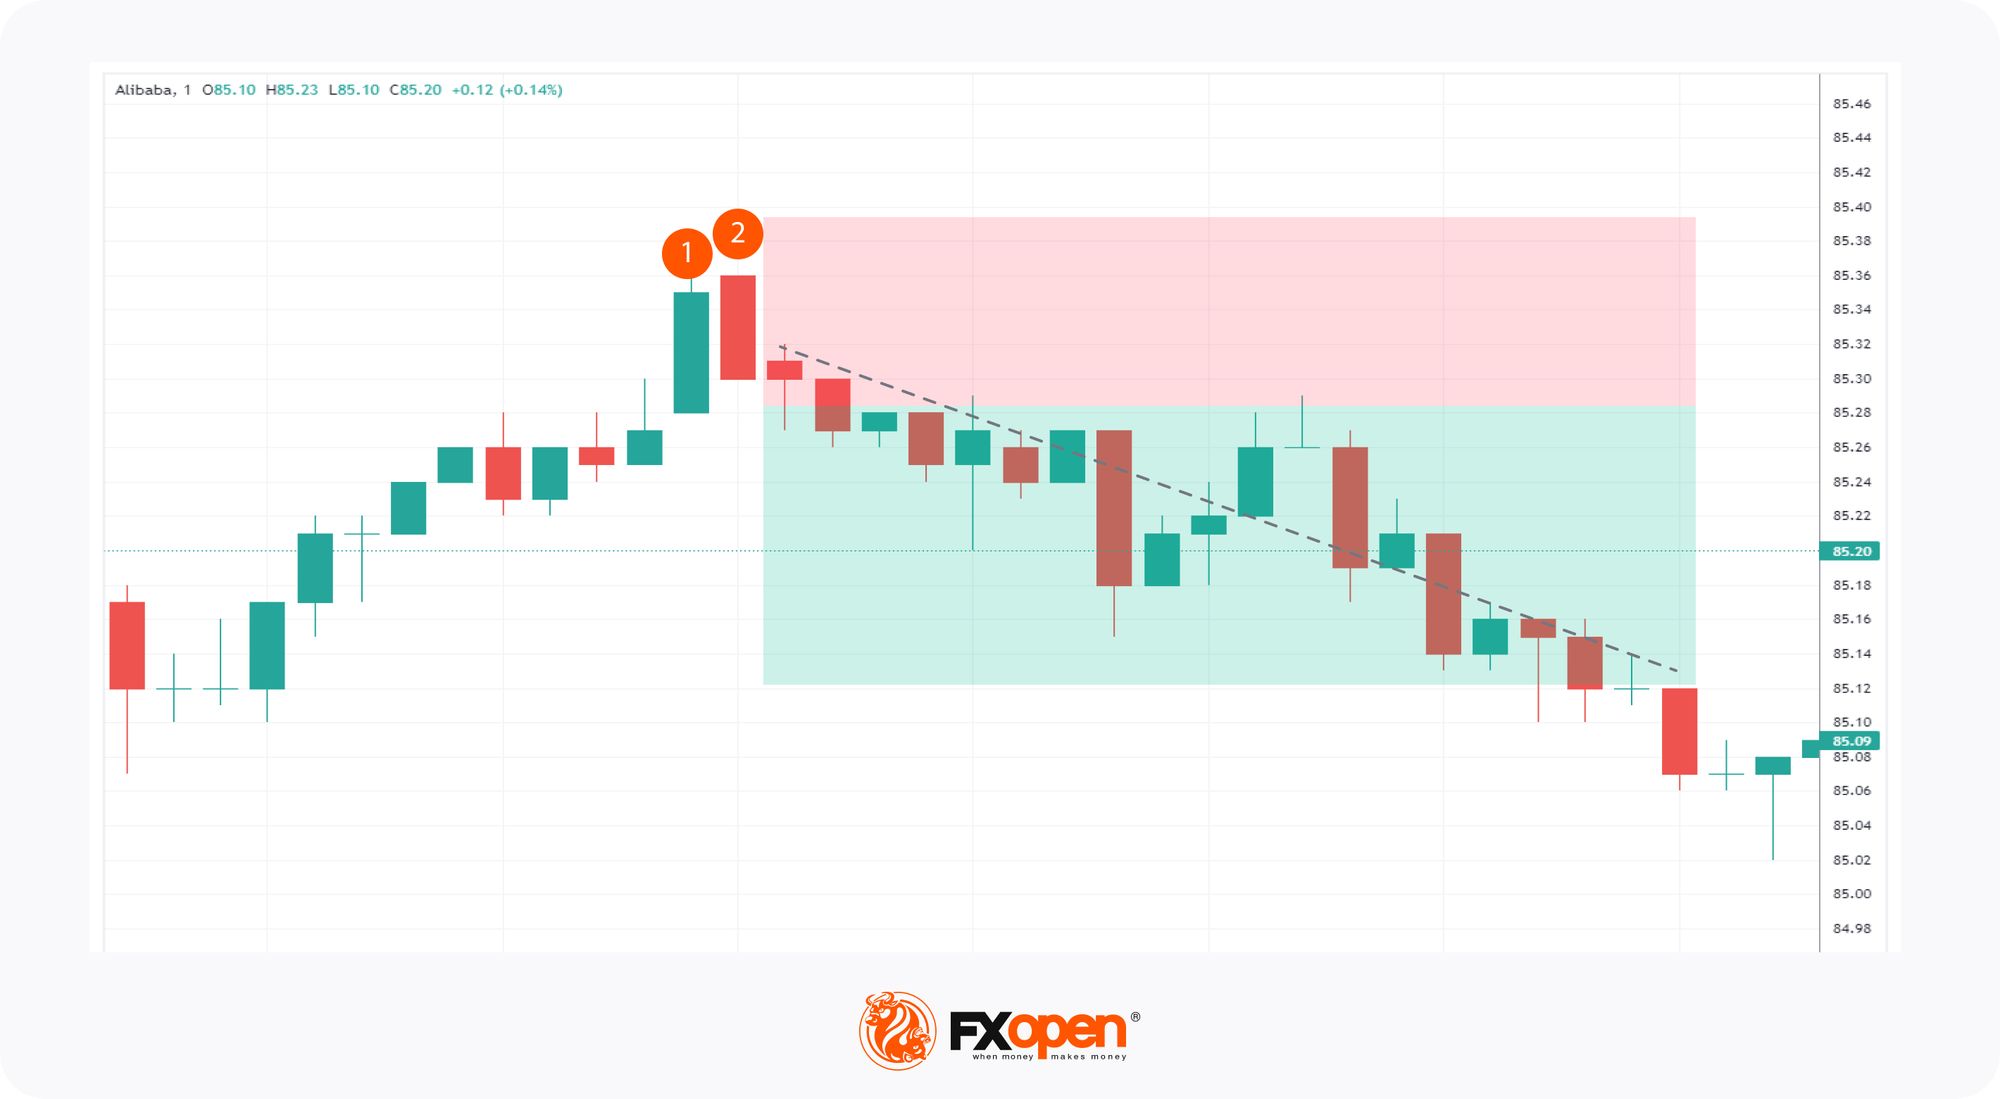
Live Market Example
A trader finds a dark cloud cover candlestick pattern (1, 2) on the 1-minute chart of Alibaba stocks. Following the general approach, they enter the market at the opening of the candle following the pattern, place a stop-loss order above the swing high and a take-profit order at the next support level.
How Traders Confirm Signals of the Dark Cloud Cover
To confirm this formation and increase its reliability, traders use several techniques and indicators. Here’s how you can confirm the pattern:
1. Confirmation Candlestick. Look for a follow-up bearish candlestick after the dark cloud cover to confirm that the bearish reversal is underway.
2. Increased Volume. An increase in trading volume on the second candlestick suggests stronger selling pressure and validates the bearish reversal signal.
3. Confirm the Uptrend. Ensure that the pattern appears after a clear uptrend. The effectiveness of the dark cloud cover as a reversal signal is higher if the preceding trend is well-established.
4. Resistance Levels. Check if the price is near a significant resistance level. It reinforces the potential for a bearish reversal.
5. Technical Indicators:
- Relative Strength Index (RSI): Use RSI to check for overbought conditions. An RSI above 70 before the pattern forms can indicate that the asset is overbought and may be due for a reversal.
- Moving Averages: Look for alignment with moving averages. For example, if the price is below a key moving average, it supports the bearish signal of the dark cloud cover pattern.
6. Trendline and Chart Patterns:
- Trendlines: Analyse trendlines for any break or weakening trend signals. A break below an upward trendline after the pattern can confirm the bearish reversal.
- Reversal Chart Patterns: Confirm with additional bearish chart patterns, which can further validate the reversal signal.
Dark Cloud Cover vs Other Candlestick Patterns
The dark cloud cover can be confused with some other formations.
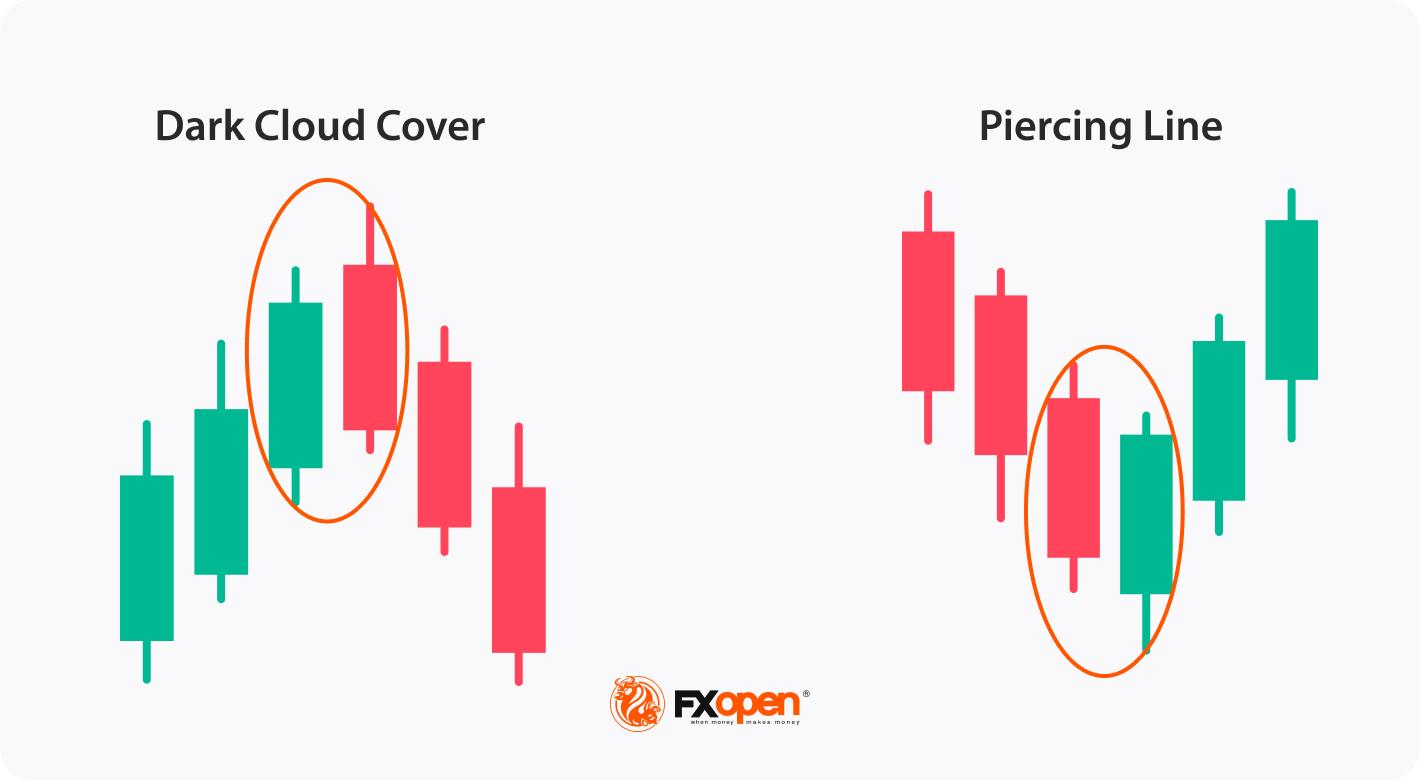
What Is the Difference Between Dark Cloud Cover and Piercing Line?
The piercing line and dark cloud cover are easily confused. The piercing line is also a two-candlestick pattern, but it consists of a long bearish candlestick followed by a long bullish candle. The bullish candle opens below the low of the previous bearish candle and closes above its middle point, indicating that bears have lost control of the market, and bulls are starting to take over.
The main difference between the bearish dark cloud cover and the piercing line is the direction of the trend preceding the formation. The former appears at the end of an uptrend, while the latter appears at the end of a downtrend. Additionally, the piercing line is considered a stronger reversal signal than its counterpart.
You can examine both formations on charts of different assets and on multiple timeframes for free using FXOpen’s TickTrader platform.
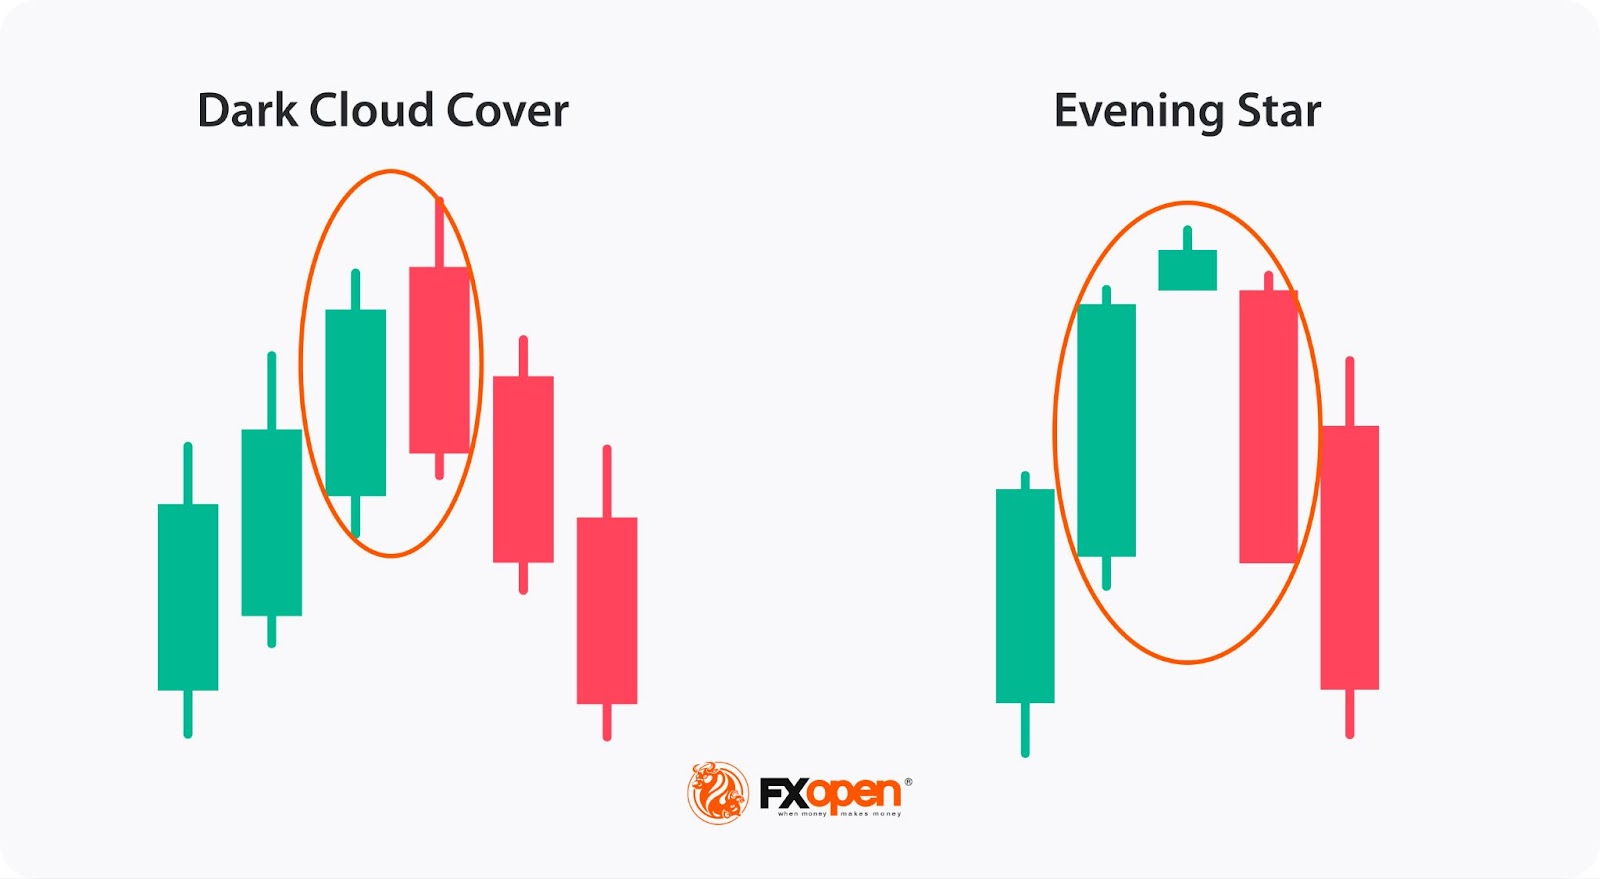
What Is the Difference Between the Dark Cloud Cover and the Evening Star?
The dark cloud cover and the evening star are both bearish reversal patterns, but they differ in their formation. The former involves two candles: a bullish one followed by a bearish one that closes below the midpoint of the first.
The latter, however, is a three-candle pattern starting with a bullish candle, followed by a small-bodied candle (which can be bullish or bearish), and ending with a bearish candle that closes below the midpoint of the first. The evening star is generally considered a stronger reversal signal.
Final Thoughts
Understanding patterns like the dark cloud cover can enhance trading strategies, but it's best to pair them with other indicators for accuracy. No strategy is foolproof, and effective risk management is always key. To apply strategies with the dark cloud cover pattern in real-time, consider opening an FXOpen account to access more than 600 markets and high-speed, low-cost trading.
FAQ
Is the Dark Cloud Cover Bullish or Bearish?
It is a bearish reversal formation that appears on a candlestick chart and indicates a potential trend reversal from an uptrend to a downtrend. It consists of a long bullish candle followed by a long bearish one that opens above the previous candle's high and closes below its midpoint.
Is the Dark Cloud Cover Reliable?
Traders don’t rely solely on this setup for trading decisions; instead, they use it as a confirmation tool along with other technical indicators, patterns, and fundamental analysis. No analytical tool is 100% reliable, and there is always a risk of false signals and market fluctuations.
What Is the Opposite of the Dark Cloud Cover?
The opposite of the dark cloud cover is the piercing line, a two-candlestick formation that appears on price charts and signals a potential trend reversal from a downtrend to an uptrend.
*At FXOpen UK and FXOpen AU, Cryptocurrency CFDs are only available for trading by those clients categorised as Professional clients under FCA Rules and Professional clients under ASIC Rules, respectively. They are not available for trading by Retail clients.
This article represents the opinion of the Companies operating under the FXOpen brand only. It is not to be construed as an offer, solicitation, or recommendation with respect to products and services provided by the Companies operating under the FXOpen brand, nor is it to be considered financial advice.
Stay ahead of the market!
Subscribe now to our mailing list and receive the latest market news and insights delivered directly to your inbox.


Latest articles

EUR/USD: All Eyes on the Fed as the Range Reaches Its Breaking Point
The dollar's next move hinges on tonight's Fed decision, and this time markets genuinely don't know what to expect. While economists still lean toward a hold—with CME FedWatch odds sitting near 68.5% for no change—Kevin Warsh's hawkish

USD/JPY and USD/CAD Test Resistance Ahead of Fresh Fed Signals
The US dollar continues to hold the upper hand against most major currencies ahead of the outcome of the latest Federal Reserve meeting. While the base-case scenario remains for interest rates to stay unchanged, markets are also pricing in the

Amazon Earnings: Does the Chart Already Know Something the Numbers Don't?
All eyes are on July 30, when Amazon reports Q2 2026 earnings, with Wall Street increasingly convinced the bar has been set too low. Consensus sees EPS near $1.82-$2.26 on roughly $197 billion in revenue, but the