


How to Trade with the Choppiness Index
FXOpen
The Choppiness Index is a valuable tool in the world of trading, particularly for experienced traders involved in analysing market trends and making informed trading decisions. Developed by Australian commodity trader E.W. Dreiss, this indicator is designed to measure price volatility or directionless behaviour. The Choppiness Index provides traders with insights into whether an asset is in a trending or ranging phase. This article describes the purpose, calculation, and application of this efficient tool. Continue reading if you need help adjusting and improving your trading strategies.
What Is the Choppiness Index?
The Choppiness Index (CI) is a technical analysis tool that helps determine whether a market is moving in a trend or consolidating. Sideways movements are challenging for traders to develop a viable strategy; thus, the Choppy market indicator, in conjunction with other technical tools, can help. A possible reversal of an existing trend can also be verified through the Choppiness Indicator. Yet, it is not a directional indicator and, therefore, cannot be used to predict future price direction.
The Choppy market index can be useful in all asset classes, but higher volatility conditions, like in stock index trading, can be more suitable for this index. If you would like to explore how to enhance your market analysis techniques using the Choppiness Indicator, head over to FXOpen and try out TickTrader’s charting tools.
How Is the Choppy Market Indicator Calculated?
The Choppiness Index is calculated through the following formula:
CI = 100 ∗ LOG10( ∑ n1ATR)( MaxHigh( n) − MinLow( n)) / LOG10( n)
Where:
- ATR( 1) = Average True Range ( Period of 1)
- SUM( ATR( 1), n) = Sum of the Average True Range over n periods
- MaxHigh( n) = The highest peak over n periods
- MinLow( n) = The lowest trough over n periods
- Log10( n) = base-10 Log of n
- n = defined period length
How to Use the Choppiness Index
The CI value provides insights into the market situation when crossing a certain level or entering a predefined area. As an oscillator-type analysis tool, the CI takes values between 0 and 100. The most common interpretations of the Choppy market indicator are derived from the Fibonacci retracement values. Generally, it is considered that a reading below 38.2 indicates a trend; a reading between 38.2 and 61.8 suggests choppy movements that would make traders wait for the emergence of a clearer trend; a high reading of the Choppy market indicator is considered above 61.8, and it indicates very choppy or consolidated prices when many traders would prefer to stick to range-bound strategies.
Depending on the specific asset, risk preference, or trading style, traders can apply different thresholds. For example, a fall below the level of 30 or a rise above the level of 50 could be considered a signal for a starting trend or the beginning of an indecision phase, respectively.
The Chop Index can be very useful in stock index trading. That market can get volatile, and the Choppy market indicator allows traders to identify potential breakouts or lower volatility periods. Below are three examples on the US SPX 500 chart of how the Choppiness Index can be implemented when analysing real markets.
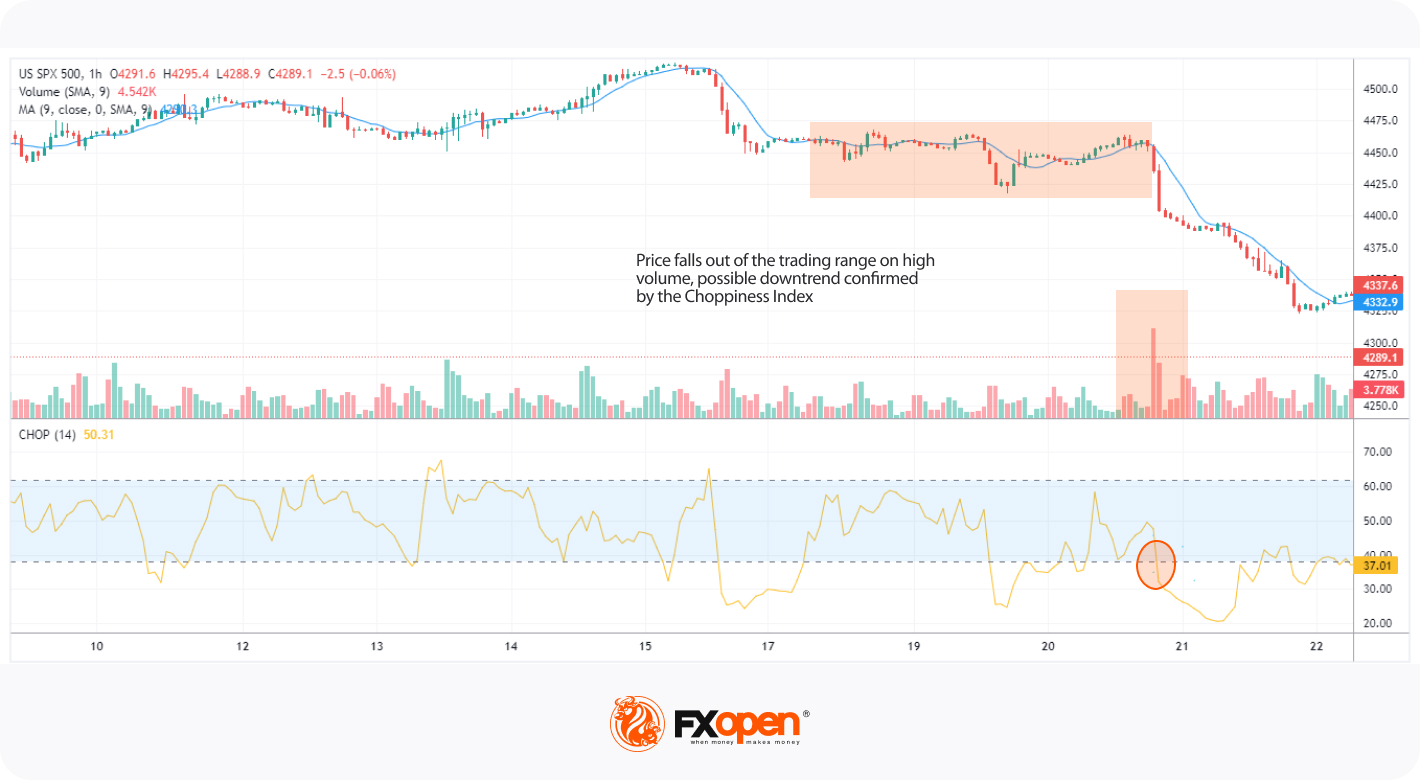
A Trending Market (A Sudden Drop in the Choppiness Index)
The CI value dropping below a certain threshold (typically below 38.2) signals that the market is starting a trending phase. This suggests that there is a clear and sustained price movement; however, as the CI does not show the direction of price movement, it may be either an upward or downward move. Traders engaged in stock index trading or interested in other asset classes may interpret this signal as an opportunity to employ trend-following strategies, such as buying in an uptrend or selling in a downtrend.
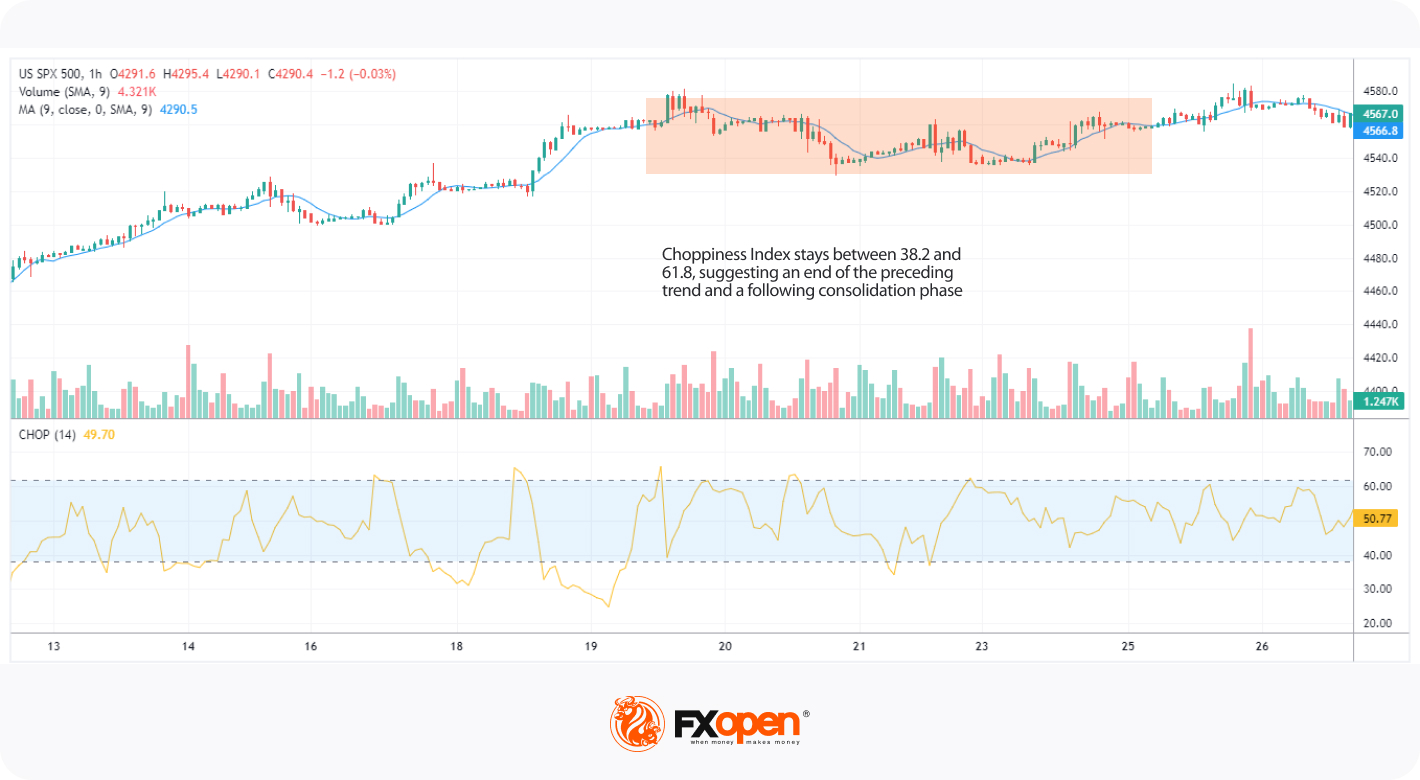
Choppy or Ranging Asset Price (Moderate Levels of the Choppiness Index)
When the CI stays within the moderate range (typically between 38.2 and 61.8), it indicates that the market is relatively choppy or ranging. As seen in the chart below, such behaviour of the CI can also be accompanied by increased volatility, implying higher market risk. In such conditions, there may be no clear or sustained trend, and prices may move within a slightly broader range but with no clear direction. Traders may exercise caution when observing such readings of the Choppy market indicator, as it can be challenging to predict the price direction. Experienced stock index trading participants might choose to reduce risk or wait for a clearer trend to develop.
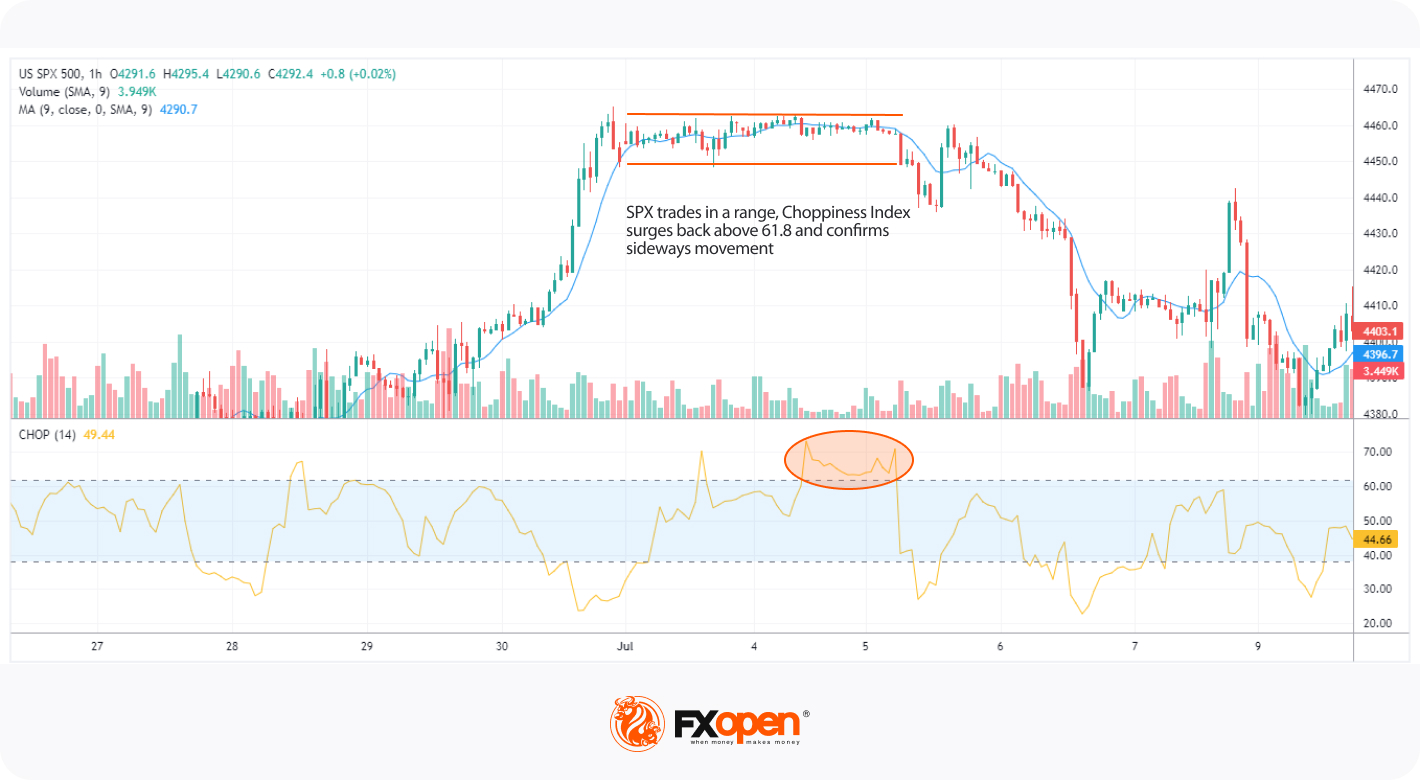
Consolidating Market (Choppiness Index Stays High)
A CI reading above a certain threshold (typically above 61.8) suggests that the market is consolidating within a narrow trading range. In the US SPX 500 stock index trading example displayed on the chart below, volatility is low, yet the price movement implies market indecision and possible unpredictable moves in either direction with no well-defined trend. In such conditions, combined with high values of the Choppy market indicator, traders may consider staying out of the market or employing range-bound or mean-reversion strategies, as breakouts and trend-following approaches may be less effective.
How to Combine the Chop Index with Other Technical Analysis Tools
Several other indicators can be combined with the Choppiness index indicator to analyse price action. Traders can identify support and resistance levels and consider the price level relative to Moving Averages, and then add the Chop index to determine an entry point in a trending market. Bollinger Bands provide another suitable indicator to be used together with the CI to identify potential breakouts of a trading range.
Combined with trading volume, the CI can provide a strong confirmation signal. After a period of sideways price action, low volume, and a high level of CI, a sudden surge in volume while the price is still in range, a drop of the index below the 38.2 level, combined with the price breaking the range, could confirm the breakout.
Conclusion
The Choppiness Index can be a valuable instrument for all asset classes, stock index trading being one possibility. It helps distinguish sideways movements from trending market activity, while it’s also used to evaluate an asset’s volatility. As the Choppiness Index cannot predict price direction, traders combine it with other technical tools, making it beneficial to a chart analysis strategy.
Interested in testing possible trading strategies using the Choppiness Index? Consider opening an FXOpen account, which grants you access to a wide range of markets and advanced trading opportunities.
This article represents the opinion of the Companies operating under the FXOpen brand only. It is not to be construed as an offer, solicitation, or recommendation with respect to products and services provided by the Companies operating under the FXOpen brand, nor is it to be considered financial advice.
Stay ahead of the market!
Subscribe now to our mailing list and receive the latest market news and insights delivered directly to your inbox.


Latest articles

NZD/USD Analysis: A Tug-of-War at the Critical Level
The kiwi has strengthened meaningfully against most peers this month. However, against the US dollar specifically, NZD/USD remains well below its 2026 highs, trading in the mid-0.58 area versus January's peak near 0.6075.
New Zealand's Q2 inflation

AUD/USD and USD/CAD React to Rising Geopolitical Risks
Commodity-linked currencies remain under pressure as geopolitical tensions in the Middle East continue to escalate. The United States has maintained strikes on targets in Iran, while the Tehran-backed Houthis have intensified threats to shipping in the Red Sea and near

GBP/CHF: Trendline or RSI — Which One Is Lying?
Sterling enters this week on firmer footing, with political uncertainty fading fast after Andy Burnham's confirmation as Labour leader eased investor concerns over the succession to Keir Starmer. Markets reacted further to reports pointing to Shabana Mahmood as the frontrunner