


How Can You Trade with the Evening Doji Star Pattern?
FXOpen

The evening doji star is a well-known candlestick pattern used to highlight potential bearish reversals. It’s made up of three candles and often appears after strong uptrends, catching traders' attention when momentum starts to fade. In this article, we explore the evening doji star, how it forms, and how to trade it.
What Is the Evening Doji Star Pattern?
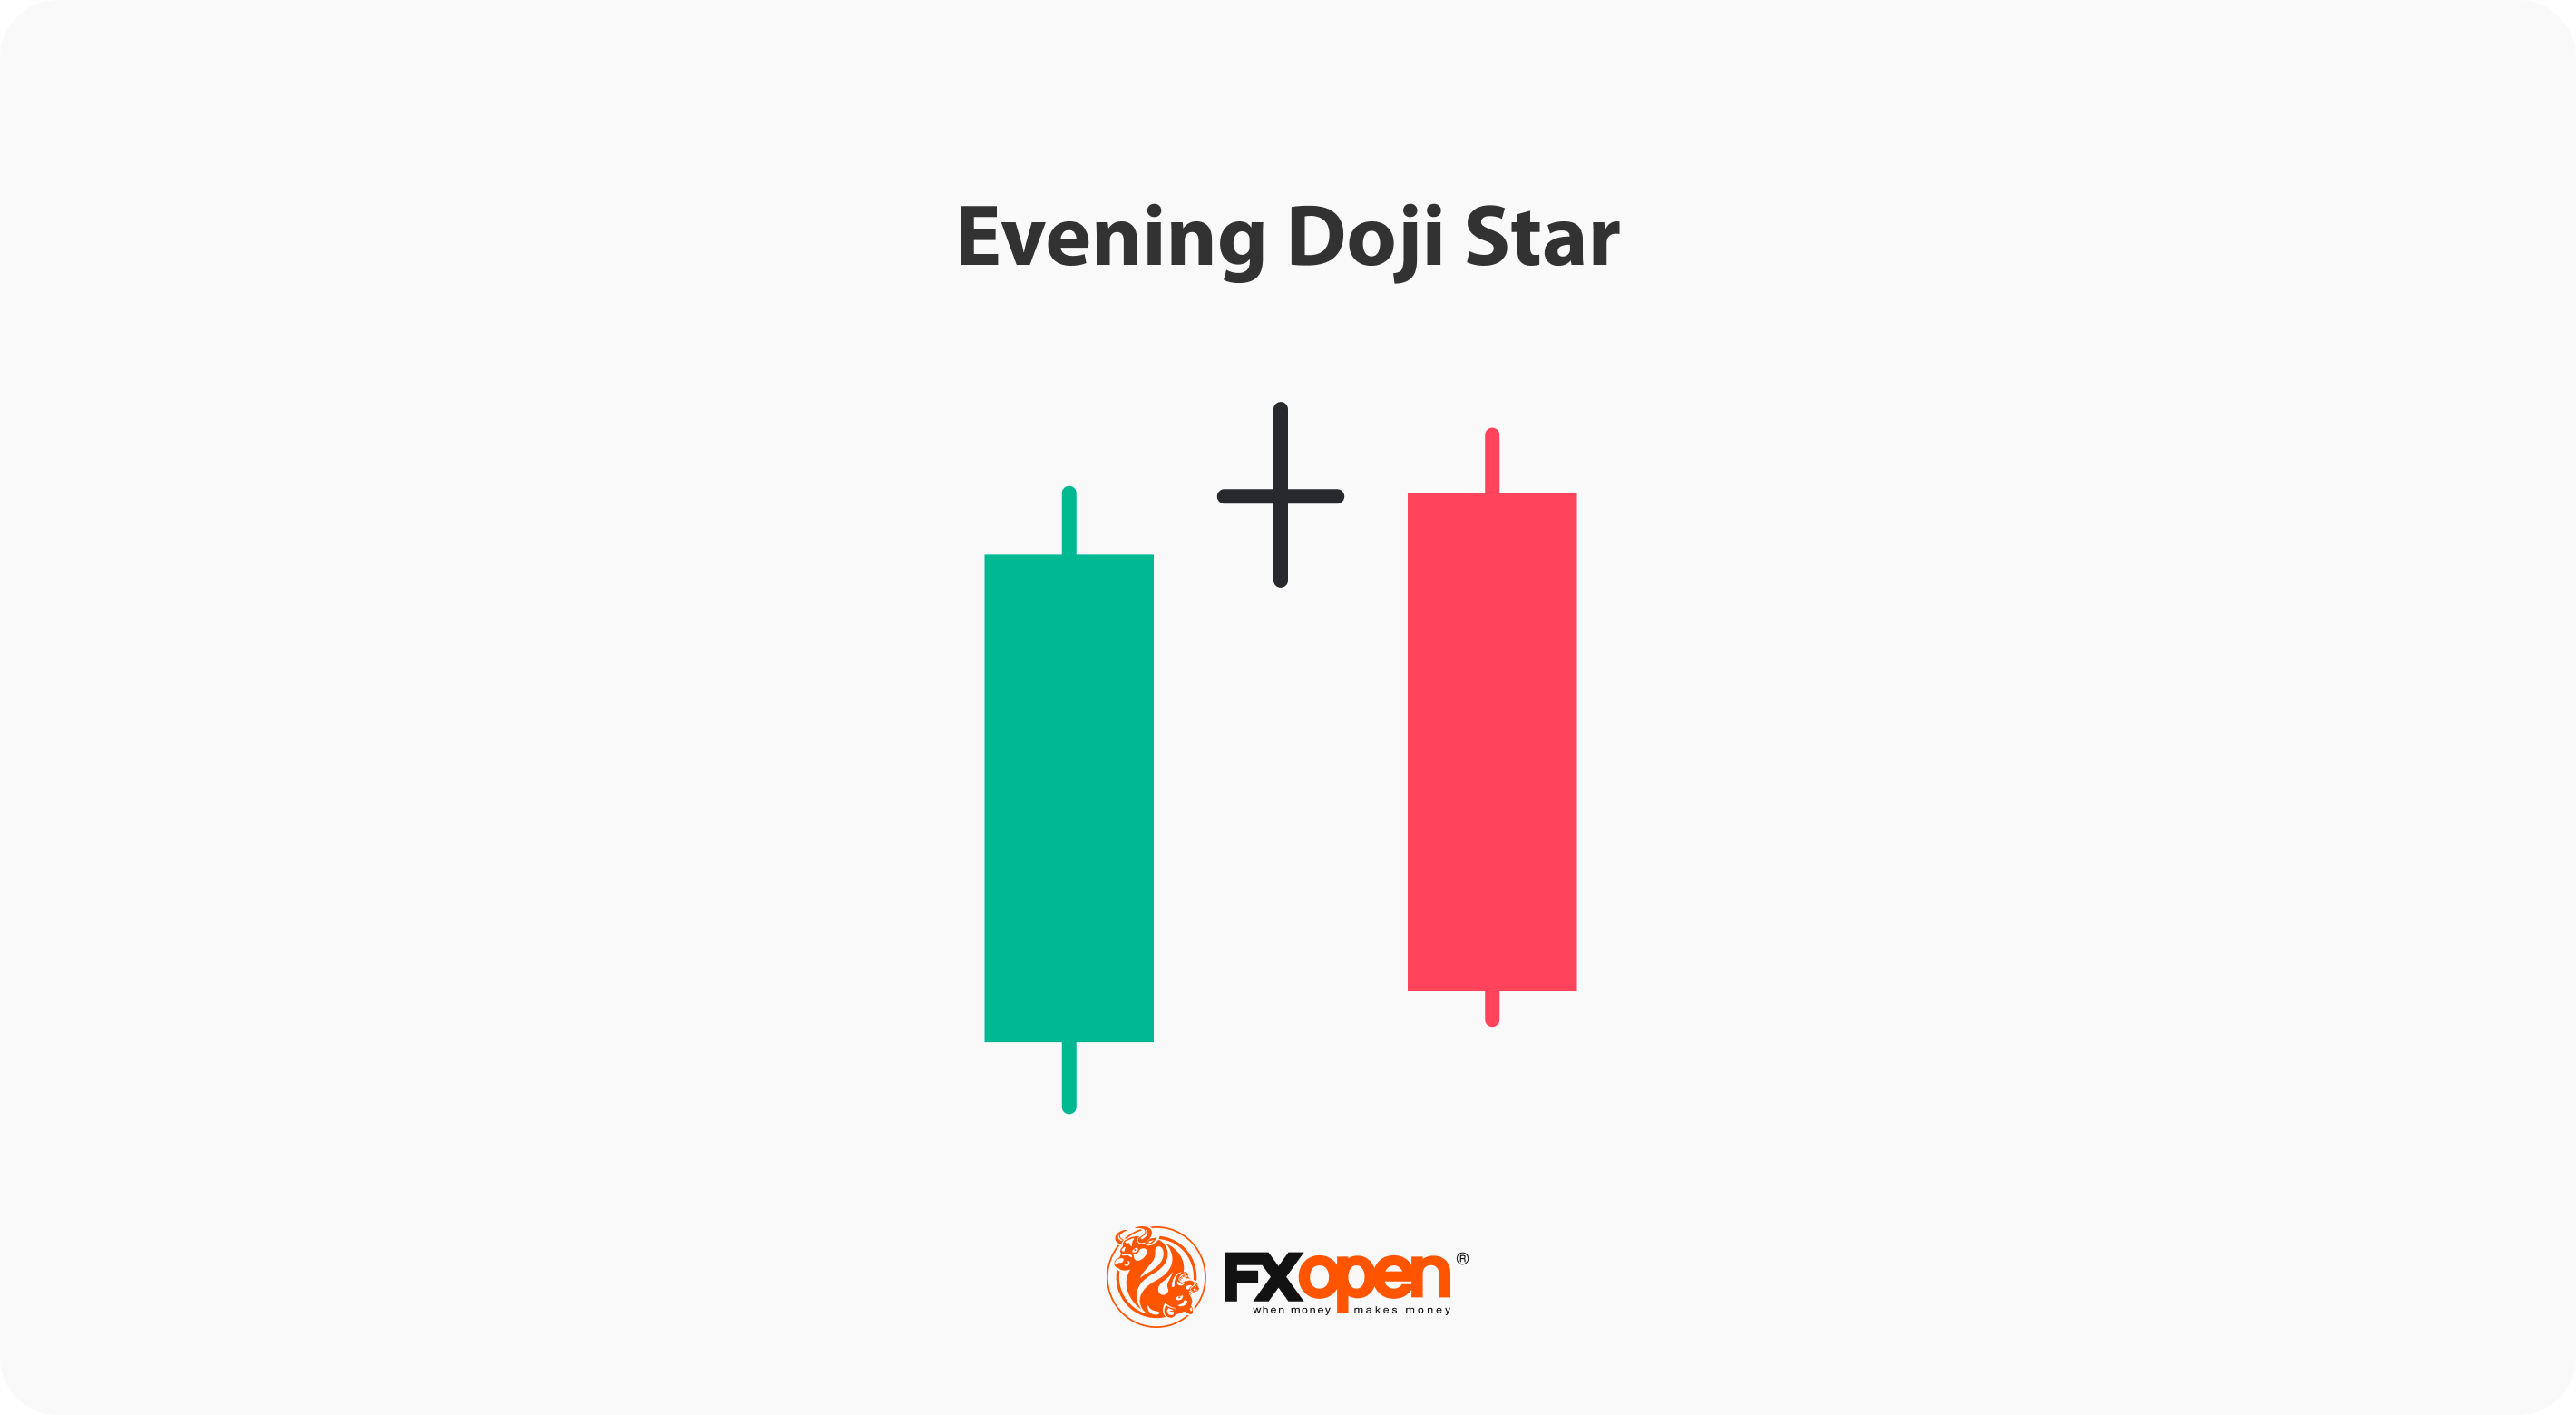
The evening doji star is a three-candle pattern that may signal a potential bearish reversal after an uptrend. It shows bullish strength giving way to hesitation, then selling pressure.
The three candles are:
- Bullish, typically strong and showing clear buying interest.
- A doji, a candle with little to no real body, where open and close level are nearly equal. This evening star doji signals indecision and may come after a small gap up.
- Sharp bearish that closes deep into the body of the first. This final candle acts as confirmation that sellers may be taking control.
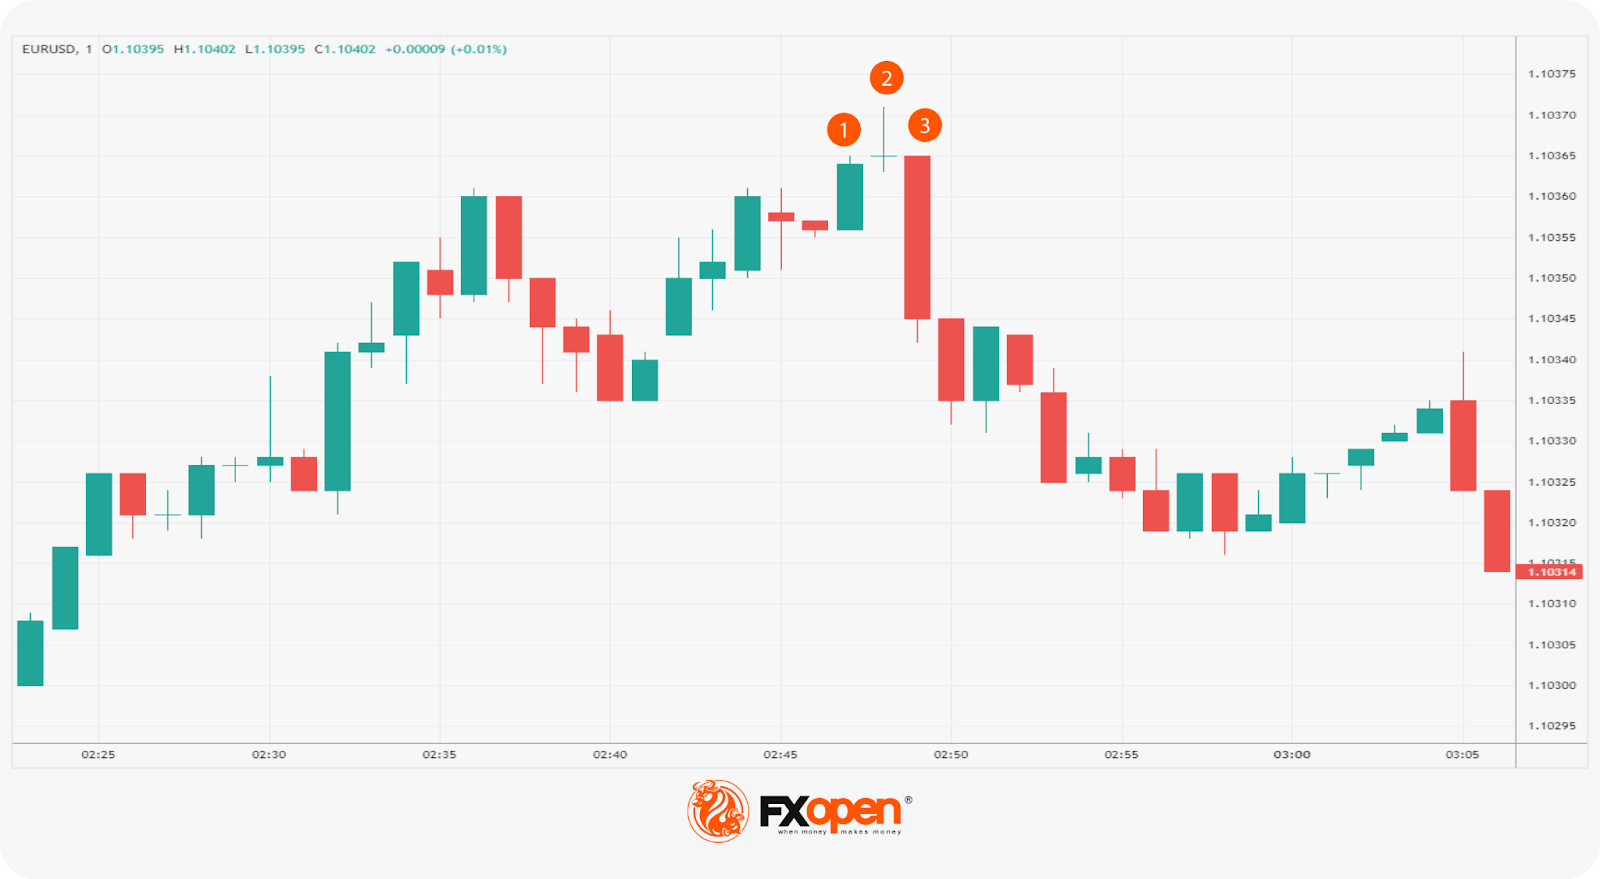
The evening doji star’s middle candle shows that an uptrend has lost steam and that the market is hesitating. The more the third candle eats into the first, the stronger the signal that sellers are stepping in.
This pattern appears most clearly on higher timeframes, like four-hour or daily charts, and is often used to spot exhaustion at the top of a trend, although it can appear on all timeframes. Traders usually look for additional confirmation before acting on it, but as far as reversal patterns go, the evening doji star can be a clear marker of an impending downtrend.
The Psychology Behind the Pattern
Each candle in the evening doji star tells a part of the story of what’s happened on a lower timeframe.
The first shows strong buyer momentum, where confidence is high. Then momentum fades and the doji in the evening star formation appears. Buyers and sellers are in relative balance, with the price not able to close much higher or lower than the open.
The third candle indicates sellers taking control, rejecting higher prices and pushing firmly in the other direction. Bulls who were driving the trend are now faced with a falling market, and some start exiting. At the same time, more aggressive bears step in on the short side. This can then lead to further bearish candles and possibly a reversal of a broader bullish trend.
What Is the Evening Doji Star Strategy?
The evening doji star candle pattern can be a valuable setup if used in the right context. The strategy involves identifying the pattern in the right context and then looking for additional confluence factors. That might include price action, volume, or indicator signals.
Opening and Closing a Trade
Traders usually look for this pattern near resistance after an extended move higher. If the price is pushing into a previous swing high, supply zone, a psychological round number or any other area where a bearish reversal may be expected and an evening doji star forms, it can mark a potential turning point.
Indicators can add confluence. For example, if a momentum indicator shows the market might be reversing, like the RSI exiting overbought levels or a bearish MACD crossover occurring, that can add weight. Tools that provide dynamic resistance levels, like moving averages or a VWAP, are also useful. Volume can matter too, with declining volume as the market rises followed by a spike in volume on the third candle offering additional insight.
Traders typically use the pattern to open a short trade, where the third candle acts as an entry confirmation. If other signals line up, they might enter the market with a market order as soon as the candle closes, setting a stop loss above the pattern’s high.
Take-profit targets might be placed at a corresponding level of support. Some could use an indicator to identify a potential bullish reversal and exit the trade. Others could treat a bullish candlestick pattern as a sign to exit or partially close the position.
Building a Short Bias or Exiting Longs
For some traders, the pattern might not be enough to enter a trade, and instead, they will wait for further bearish candles or a downtrend structure to materialise before jumping in. Also, they may use the formation to build an overall short bias to identify lower timeframe setups, especially if it appears on a higher timeframe chart.
Those in long positions might see the evening doji star as a signal to close or reduce a long position, especially if it occurs at a suitable place to exit (like a resistance level).
If you want to add the pattern to your toolkit and build your own trading strategy, open an account on the TickTrader trading platform by FXOpen and refine your trading approach with over 1,200 trading tools.
Strength and Limitations
As with all patterns, the evening doji star isn’t infallible. There are key strengths and limitations that traders should be aware of before implementing it in their trading strategies.
Strengths
- Clear to be identified: The three-candle structure is straightforward and easy to remember, as opposed to more complex patterns.
- Marks a clear momentum shift: The pattern follows a simple formula, where bulls get exhausted, indecision creeps in, and then the market moves to the downside.
- Useful in extended markets: If the price has rallied hard and this pattern forms in a logical area, it can help identify a valuable reversal signal.
Limitations
- Context matters: Without other supporting factors, the pattern doesn’t mean much. For instance, it may have less significance if the price is bouncing off a strong support level.
- Targets are open-ended: Compared to chart patterns that may have defined projection levels for targets, traders must identify their own targets with the evening doji star.
- False signals do occur: Even with strong setups, the formation will fail sometimes. This is especially true in choppy sideways markets.
Comparison With Other Candlestick Patterns
The evening doji star is easy to get mixed up with other similar patterns that typically occur at the top of an uptrend.
Evening Star
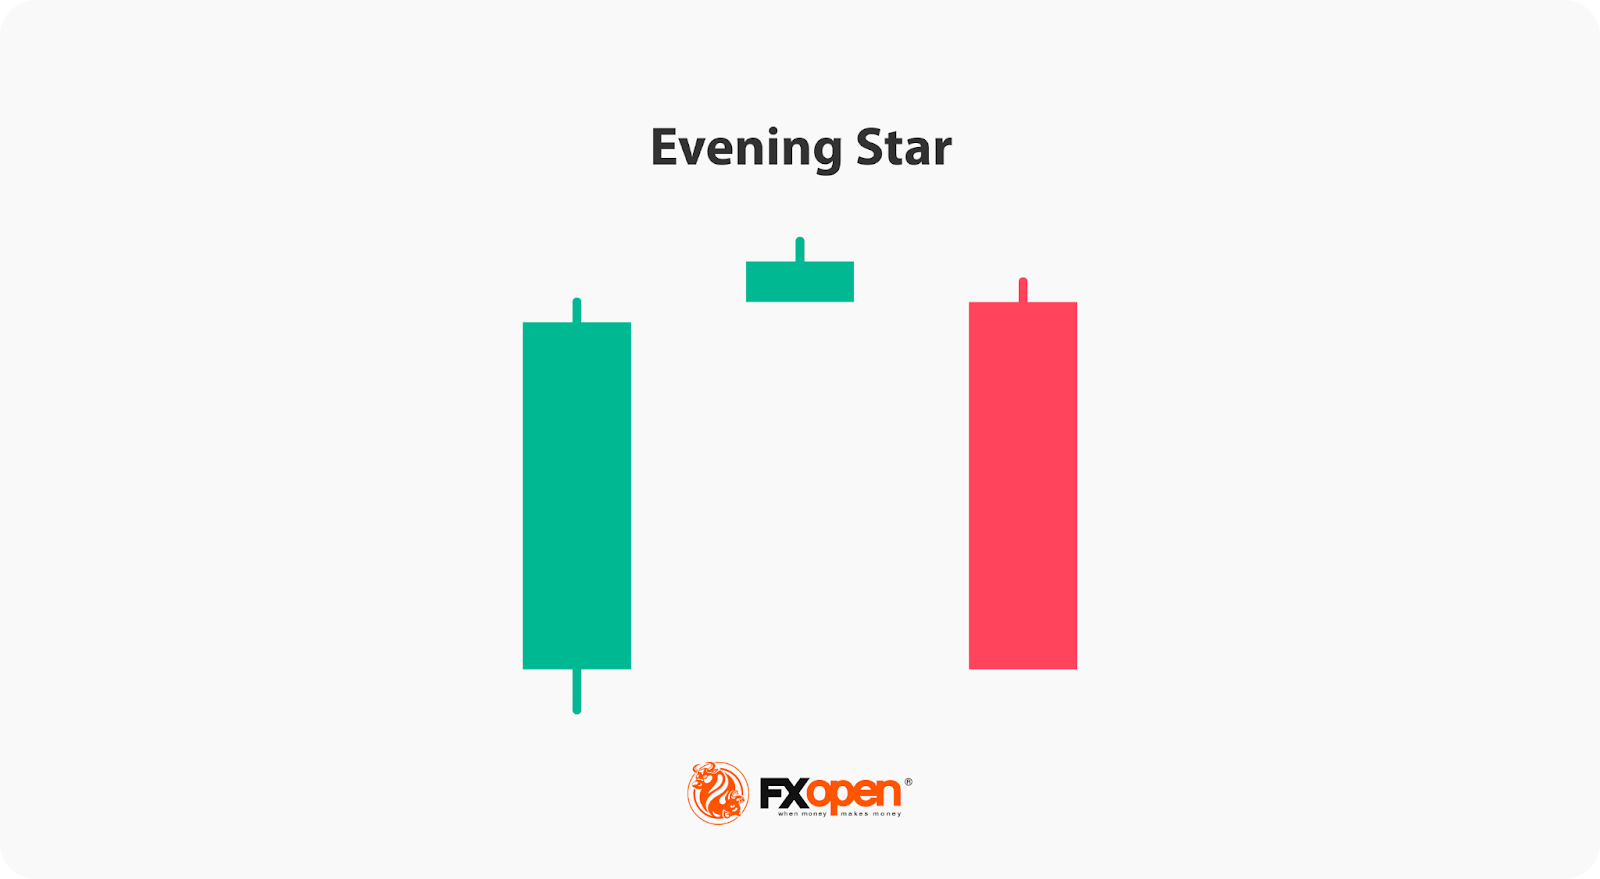
The only real difference is the middle candle. In an evening star, the second candle has a small real body. It still shows hesitation, but not as much as a doji. The doji version reflects stronger indecision, which some traders view as more meaningful. Both patterns show a shift in control, but the evening doji star signals it more sharply.
Morning Doji Star
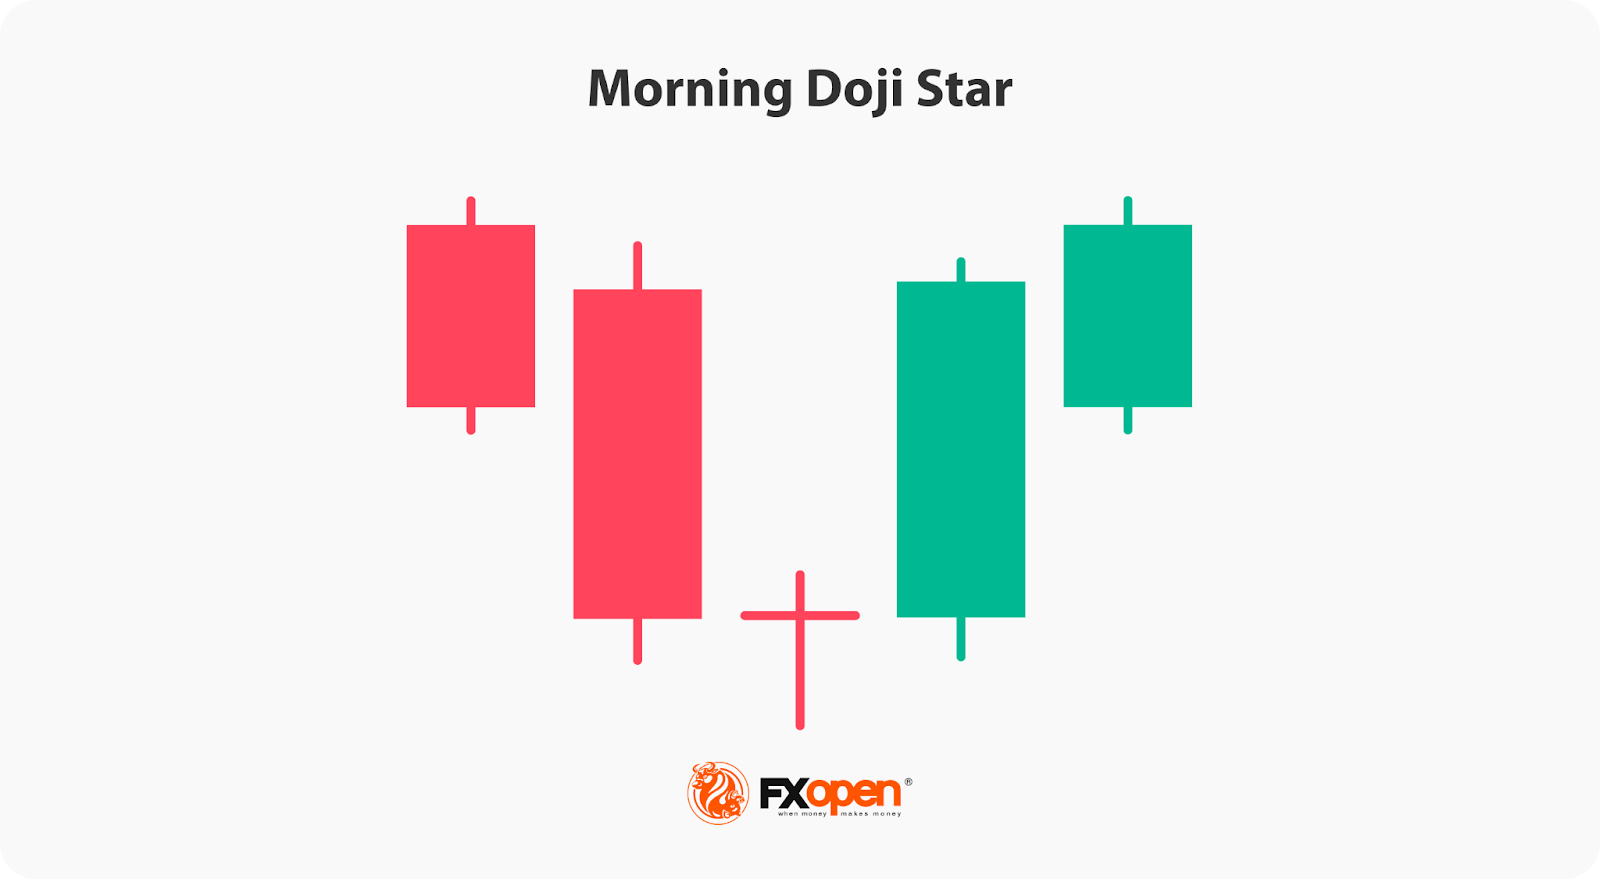
These are mirror images. The morning version is bullish — it forms at the end of a downtrend and hints at a potential upward reversal. It has the same structure: bearish candle, doji, then a strong bullish close. It’s used in the same way but just forms at the opposite end of a trend.
Shooting Star
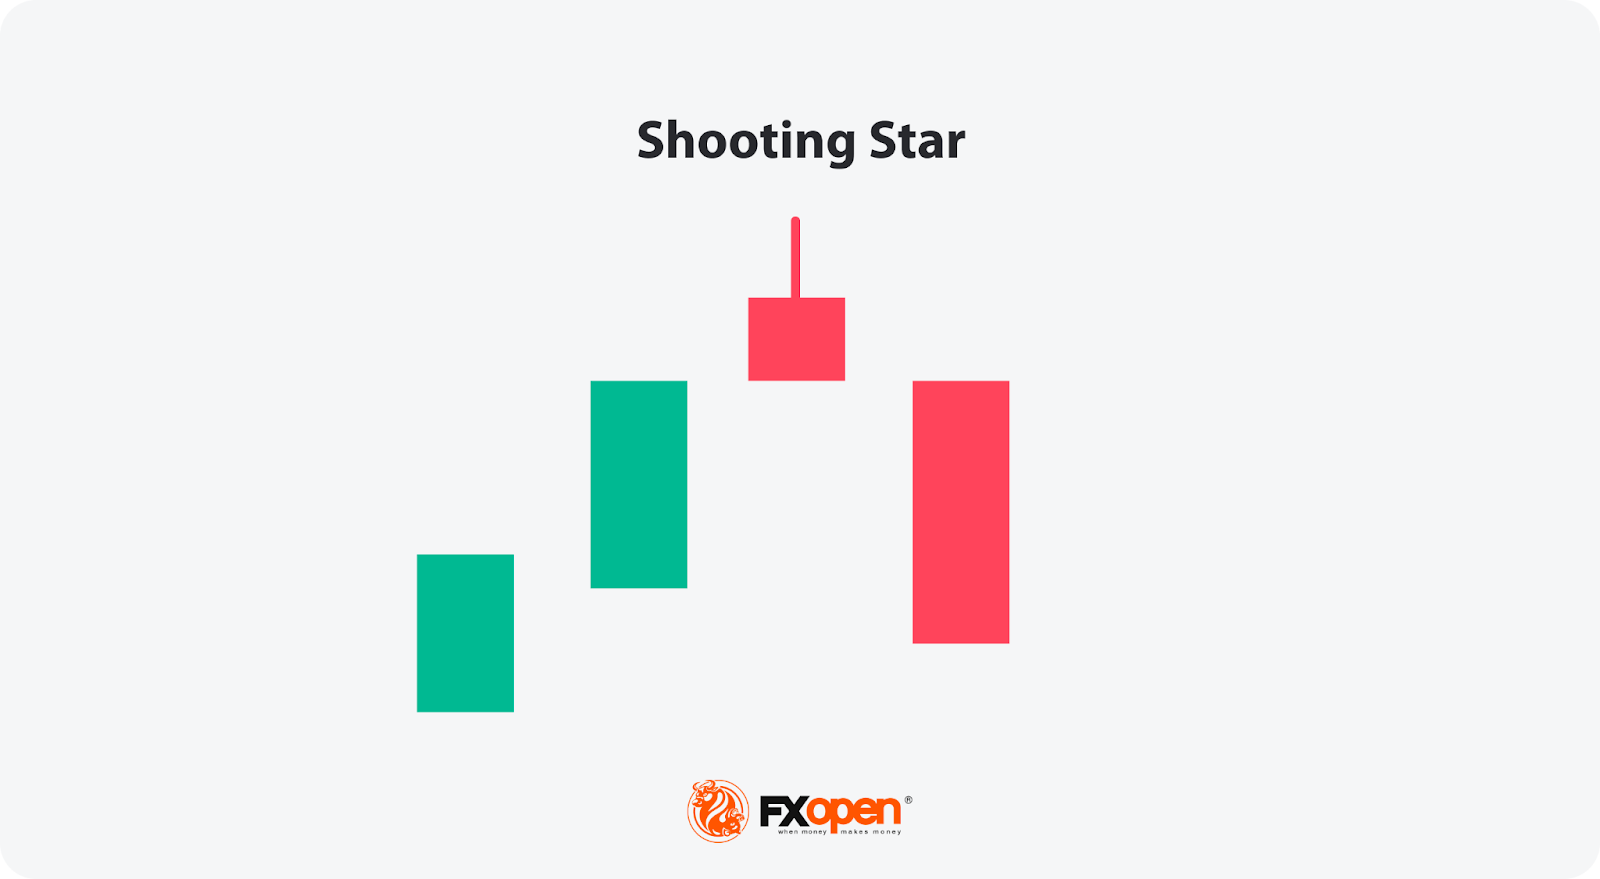
A shooting star is a single candle with a small body and a long upper wick. It reflects the rejection of higher prices without the multi-candle context of the evening doji star. It takes less time to form, but may also be less reliable than the evening doji star’s three-candle pattern.
Bearish Engulfing
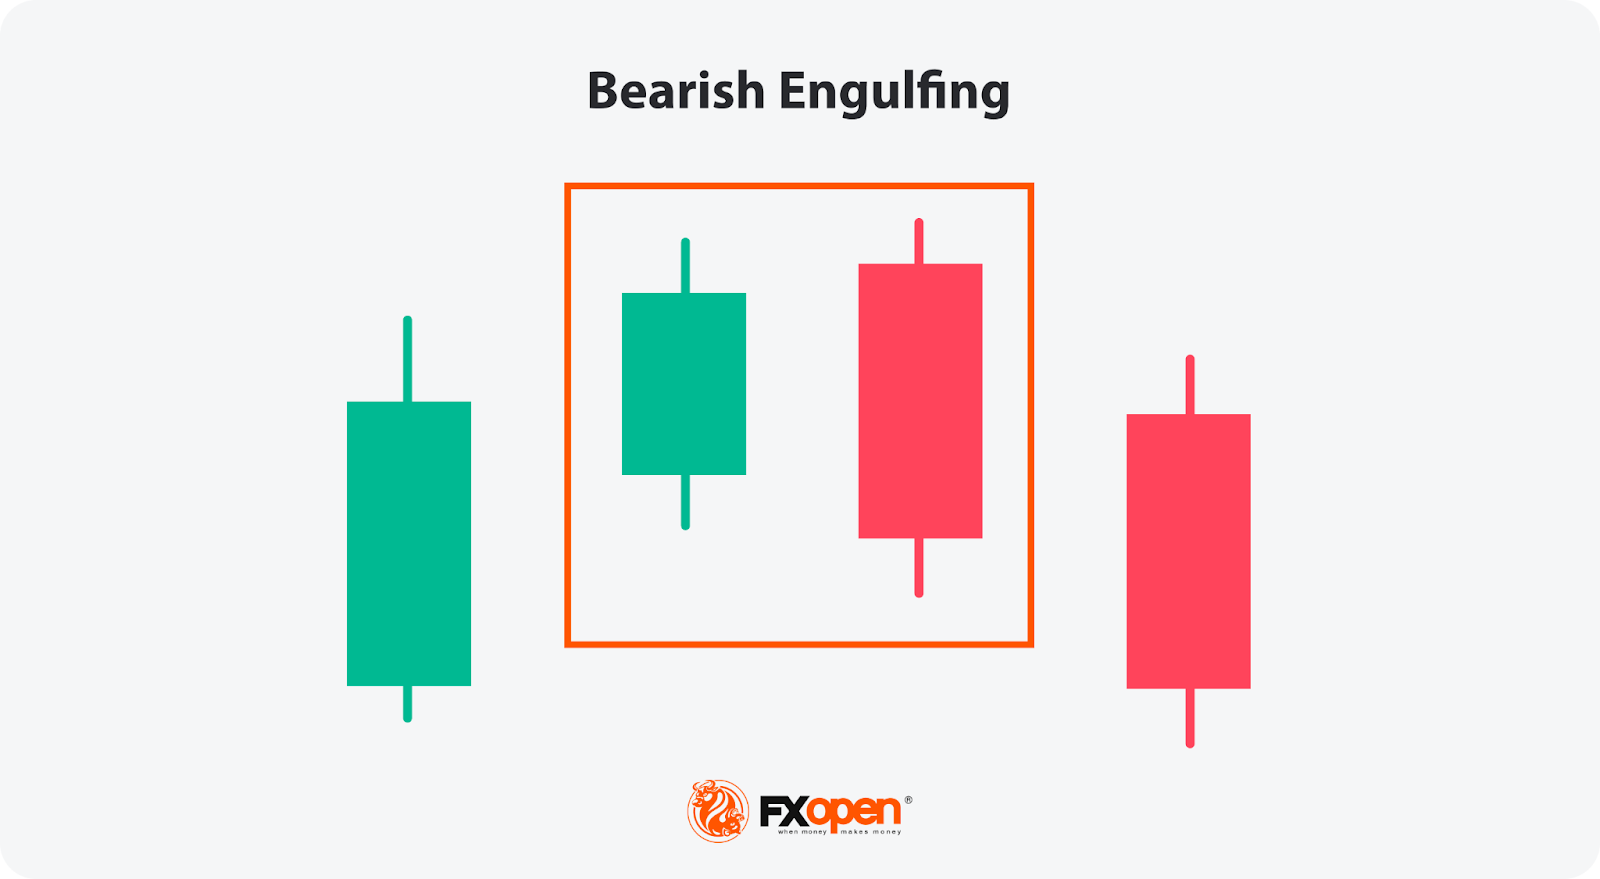
The bearish engulfing pattern has just two candles, with the second fully covering the first. It’s more abrupt, often seen in fast-moving markets. It indicates a similar move from bullish to bearish, but it lacks the moment of hesitation that makes the doji-based pattern useful when reading momentum.
The Bottom Line
The evening doji star is a popular candlestick pattern among traders with all experience levels. Although it might not be a signal to act on alone, when used in context, it can provide a strong bearish reversal setup. To enhance its reliability, traders incorporate this formation into more comprehensive trading strategies.
Consider opening an FXOpen account if you’re looking to explore technical analysis patterns and indicators across more than 700 live markets with tight spreads and low commissions.
FAQ
What Is the Meaning of Evening Doji Star?
The evening doji star is a three-candle bearish reversal pattern that shows buyers possibly giving way to sellers. It forms after an uptrend and consists of a strong bullish candle, a doji showing indecision, and a bearish candle that closes into the body of the first, potentially marking the start of a new downtrend.
How to Trade Evening Doji Star?
Traders typically use the evening doji star to enter a potential bearish movement at its early stages, especially when it forms at an area of resistance or is confirmed by an indicator. Traders often enter on the close of the third candle with a stop-loss level above the pattern, though may seek greater confirmation from additional candles or bearish structure.
This article represents the opinion of the Companies operating under the FXOpen brand only. It is not to be construed as an offer, solicitation, or recommendation with respect to products and services provided by the Companies operating under the FXOpen brand, nor is it to be considered financial advice.
Stay ahead of the market!
Subscribe now to our mailing list and receive the latest market news and insights delivered directly to your inbox.


Latest articles

GBP/USD and EUR/GBP Await Key Bank of England Decision
The pound strengthened following the outcome of the US Federal Reserve meeting, where the central bank, as expected, kept interest rates unchanged. However, the Fed did not provide the market with clear signals of an imminent shift towards rate cuts,

Microsoft Analysis: Earnings Beat Expectations
On 29 July 2026, Microsoft reported its results for the fourth quarter of fiscal year 2026. Revenue reached $90 billion, up 18% year-on-year, while adjusted earnings per share came in at $4.74, comfortably ahead of analysts' expectations of $4.

EUR/USD: All Eyes on the Fed as the Range Reaches Its Breaking Point
The dollar's next move hinges on tonight's Fed decision, and this time markets genuinely don't know what to expect. While economists still lean toward a hold—with CME FedWatch odds sitting near 68.5% for no change—Kevin Warsh's hawkish