


How to Trade with the Guppy Multiple Moving Average
FXOpen

Understanding market trends is critical to trading success. The Guppy Multiple Moving Average is a powerful tool that can help traders gauge trends and identify potential reversals. In this article, we’ll explore the basics of the Guppy Multiple Moving Average, its various applications, and how to trade its signals.
What Is the Guppy Multiple Moving Average?
The Guppy Multiple Moving Average (GMMA) is an indicator designed to help traders identify and understand price trends. Developed by Australian trader and author Daryl Guppy, the GMMA is a combination of 12 exponential moving averages (EMAs) divided into two distinct groups: the short-term group and the long-term group.
The short-term group consists of six EMAs over 3, 5, 8, 10, 12, and 15 periods, while the long-term group includes six EMAs with periods of 30, 35, 40, 45, 50, and 60. By analysing the interaction between these Guppy indicator averages, we can gain insight into the prevailing market sentiment and the strength of trends.
What makes the indicator particularly useful is its ability to reveal changes in trend direction with greater clarity than traditional moving average setups. By using multiple moving averages (MAs), the GMMA helps filter out market noise and offers a more accurate representation of the overall trend. It’s also a versatile tool; traders can apply the Guppy indicator to forex, stocks, commodities, crypto*, and more.
What Is the Super Guppy Indicator?
The Super Guppy indicator is an advanced version of the GMMA, comprising seven short-term and 15 long-term averages. It was created by Chris Moody and is designed to provide enhanced trend identification and trading signals.
How to Use the GMMA
While the GMMA is a relatively simple indicator compared to other technical analysis tools, it has multiple uses: identifying trend strength, reversals, and ranging conditions.
How to Identify Trend Strength
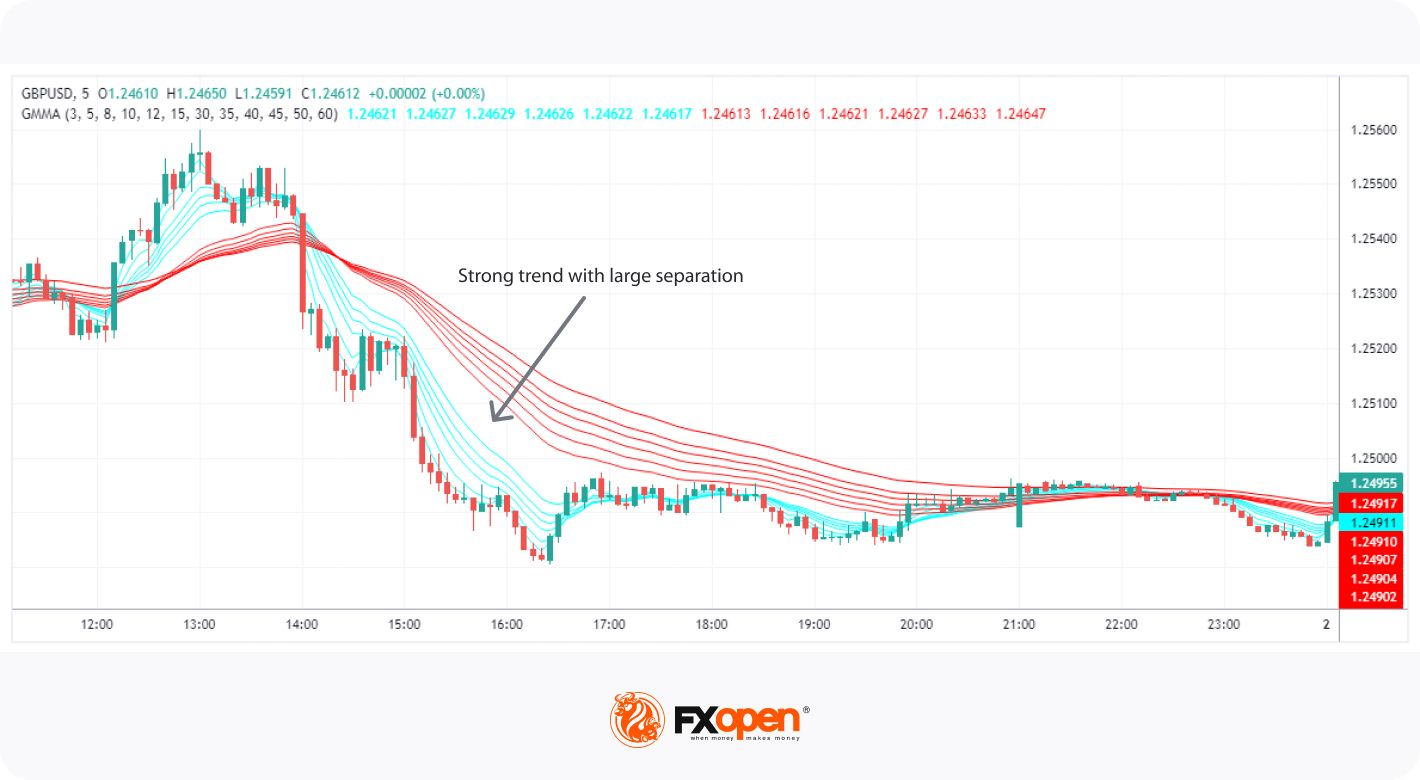
To identify trend strength, we look at the relationship between the shorter- and longer-term averages. In a strong trend, the short-term group will be significantly separated from the long-term group. The wider the distance between the two groups, the stronger the trend. Conversely, if the Guppy indicator exponential MAs move close together, the trend may be losing steam or undergoing a reversal.
How to Identify Trend Reversals
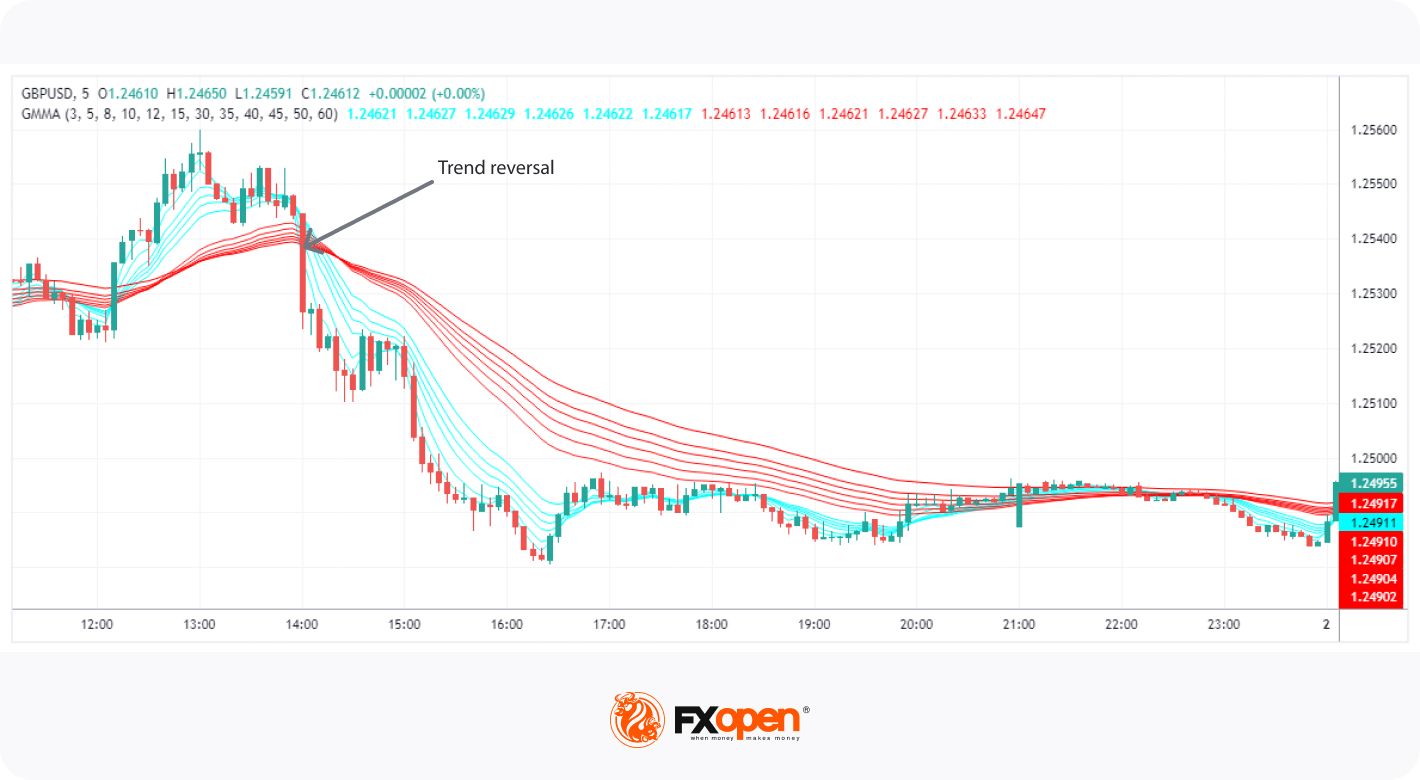
The GMMA may help traders spot potential trend reversals by looking for crossovers between the short-term and long-term moving groups. A bullish trend reversal may be demonstrated when the short-term averages cross above the long-term. Similarly, a bearish trend reversal might be indicated when the short-term averages cross below the long-term.
How to Identify a Lack of Trend
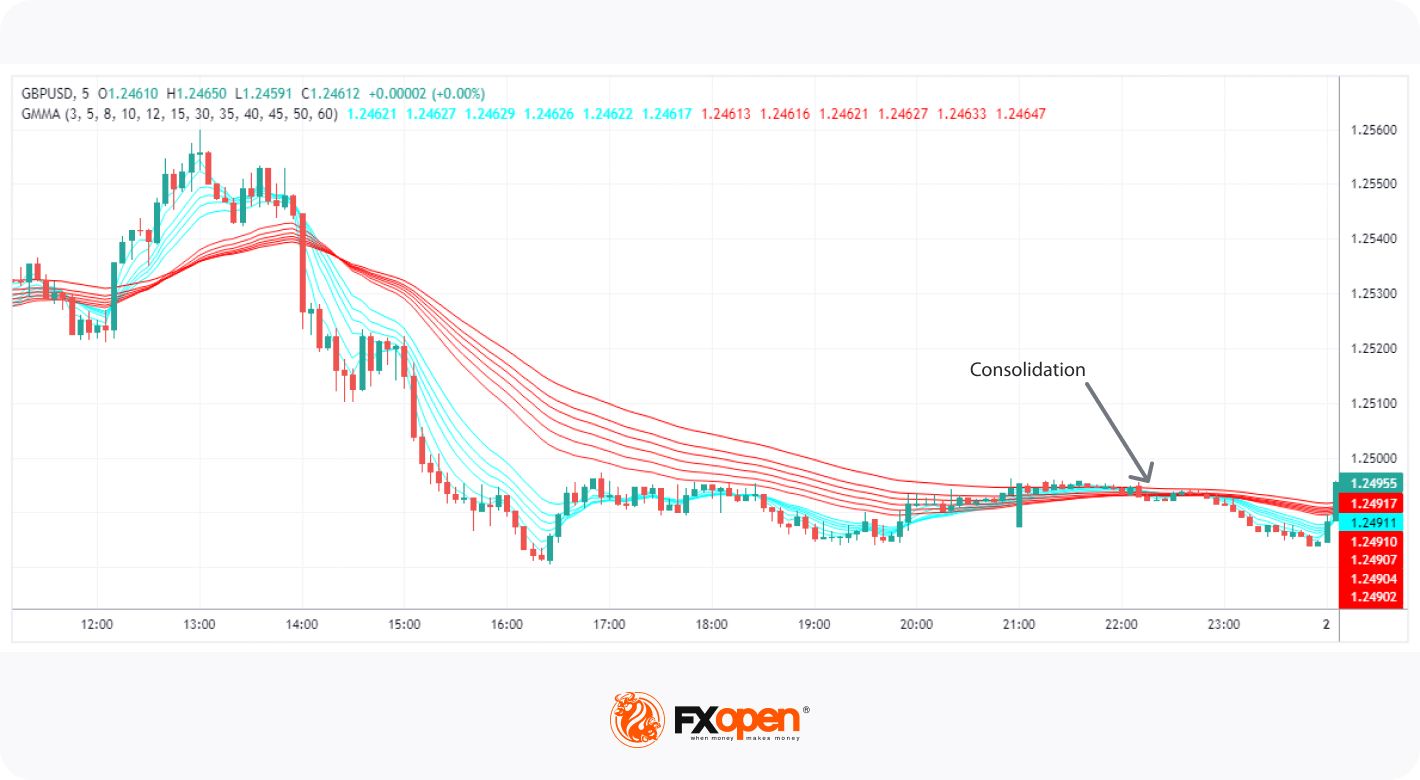
A sideways market is often a challenging environment for traders. The GMMA allows us to spot these market conditions by observing the compression of the MAs. Compression occurs when the short-term and long-term groups converge and become tightly clustered together, indicating that the market is experiencing a period of consolidation.
How to Trade with the Guppy MMA
While the GMMA may help traders predict future price movements, it also offers some defined signals that we can use to find Guppy MMA entry points.
Want to try your hand and identify these signals yourself? Head over to FXOpen’s free TickTrader platform to set up your own Guppy chart.
Buy Signals
In essence, traders can go long when the short-term averages cross above the long-term ones. However, to improve accuracy, it’s best to look for these trades when there’s a larger bullish trend or a prolonged bearish trend that is ripe for a reversal.
When a strong bullish trend is present, we may also look for short-term averages to retrace to the longer term but avoid crossing them. This could indicate a slight pullback before the larger move continues.
Sell Signals
The indicator’s sell signals are effectively the opposite of its buy signals, primarily looking to go short when the short-term averages cross below the long-term ones. Likewise, accuracy might be boosted by looking for these signals in a strong downtrend or when the pair is overbought (which may be determined using other indicators, like the relative strength index).
No Signal
There will be instances when the GMMA doesn't provide a clear trading signal. This often occurs during periods of consolidation, when the groups fluctuate little and have no significant separation. In these scenarios, it’s crucial to be patient and avoid trading based on ambiguous signals.
GMMA Compression Breakout Strategy
While periods of consolidation may offer few decisive signals, we can use them to anticipate a breakout.
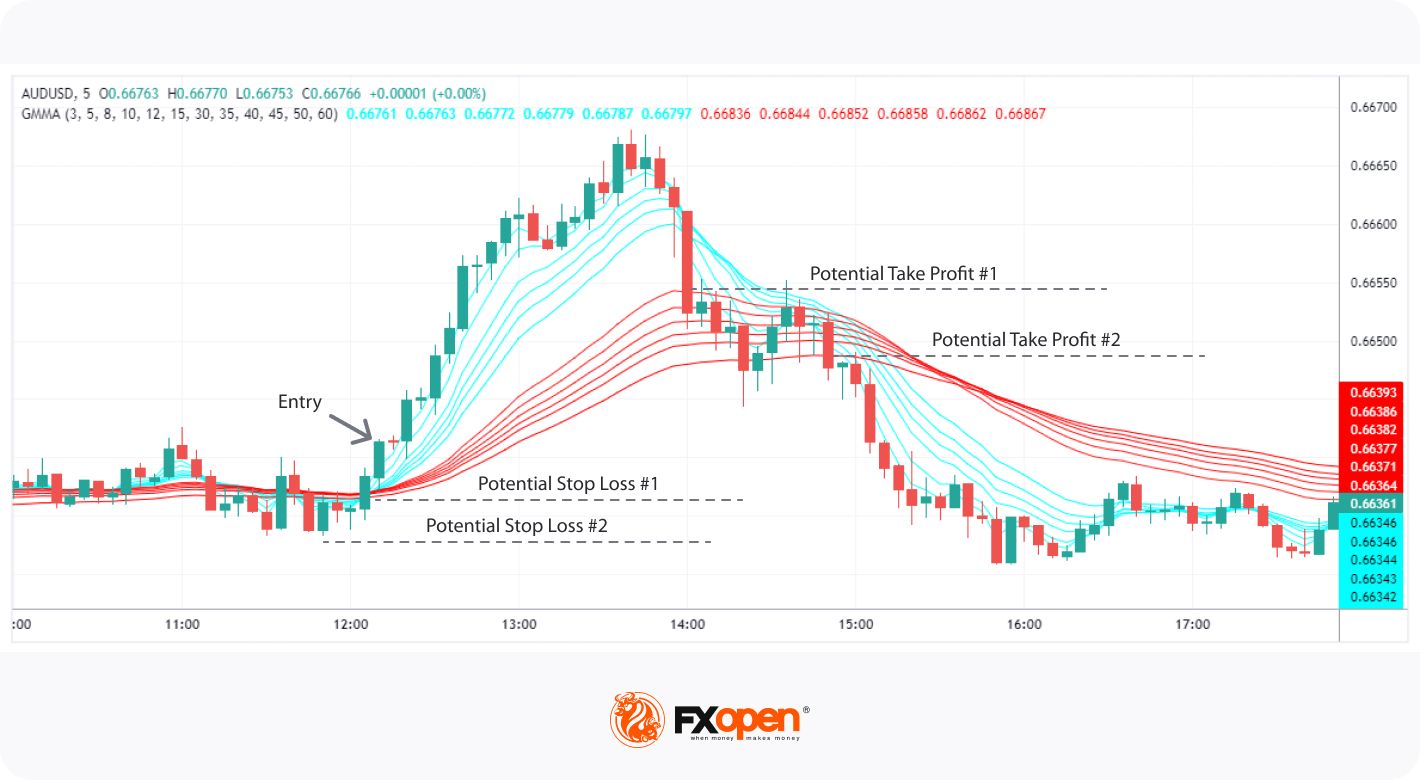
To use this strategy, we first look for instances where the short-term and long-term averages are tightly clustered, showing very little separation. After a breakout from this compressed state with a widening of the MAs is observed (usually accompanied by strong price action and/or a break beyond a support/resistance level), we could enter on the close of the current candle.
Stop losses may be placed above/below the long-term averages, depending on the direction of the trade, or beyond nearby swing points.
The GMMA doesn’t offer clear take-profit placement. However, you could choose to close the trade at a significant support/resistance level when the price retraces to the long-term averages or when the two groups cross over.
Summary
In conclusion, the GMMA is a valuable tool for traders looking to capitalise on market trends, offering multiple indications and tradeable signals. If you want to put your knowledge to the test, you can open an FXOpen account to gain access to over 600 markets, low trading costs, and super-fast execution speeds. Happy trading!
*At FXOpen UK and FXOpen AU, Cryptocurrency CFDs are only available for trading by those clients categorised as Professional clients under FCA Rules and Professional clients under ASIC Rules, respectively. They are not available for trading by Retail clients.
This article represents the opinion of the Companies operating under the FXOpen brand only. It is not to be construed as an offer, solicitation, or recommendation with respect to products and services provided by the Companies operating under the FXOpen brand, nor is it to be considered financial advice.
Stay ahead of the market!
Subscribe now to our mailing list and receive the latest market news and insights delivered directly to your inbox.


Latest articles

Weekly Market Insights with Gary Thomson: The Week of Central Banks and Earnings
In this video, we’ll explore the key economic events and market trends, shaping the financial landscape. Get ready for insights into financial markets to help you navigate the week ahead. Let’s dive in!
In this episode of Market

Intel at a Crossroads: Earnings Beat Meets Technical Resistance
Intel has just delivered its strongest quarter in over fifteen years, and the market reaction says it all. Q2 2026 revenue surged 25% year-over-year to $16.1 billion, crushing the consensus estimate of $14.42 billion, while adjusted EPS of

Tesla: Complex Range Structure Breaks Down Following Quarterly Earnings
Tesla released its Q2 2026 results after the market closed on 22 July. Revenue increased 26% year-on-year to $28.24 billion, while vehicle deliveries reached a record 480,126 units. However, operating margin fell sharply to 1.4%, down from