FXOpen
Traders strive to identify structures and indicators that can assist their decisions. One such pattern that has garnered attention is the hockey stick. Whether you are an experienced trader or just starting your journey in the world of trading, understanding this hockey stick effect can be a valuable addition. In this FXOpen article, we will explore what this pattern is, how to spot it, and, most importantly, how to trade it effectively by identifying the hockey stick growth curve.
What Is the Hockey Stick Pattern?
The term hockey stick pattern is used to highlight a significant change or inflection point in a trend or data series. The name comes from the shape of a hockey stick, with its long handle and curved blade. This pattern can refer to a few different concepts depending on the context in which it is used. Here are two common interpretations:
- In Finance and Economics: A hockey stick pattern can describe a financial or economic trend that resembles the shape of a hockey stick. In this context, it typically refers to a situation where there is a relatively flat or stable period followed by a sudden and significant upward (or sometimes downward) movement. This formation can be seen in various economic indicators, such as a sudden surge in stock prices.
- In Data Visualization and Business: The pattern is also used to describe a particular shape in data graphs or charts. It's often seen in business presentations, especially related to sales or revenue. In this context, the hockey stick represents a slow or steady start followed by a sharp increase in numbers.
In this article, we will consider the hockey stick trading pattern.
How to Spot the Hockey Stick in the Chart?
Here are some key characteristics:
Gradual Build-Up: The pattern begins with a period of stability or slow development, often represented by a nearly horizontal or slightly inclined line resembling the blade of a hockey stick. Given its shape, it is also known as the “blade phase” of the hockey stick pattern.
Inflection: The most defining feature of the formation is the sudden and steep upward curve that follows the initial flat phase.
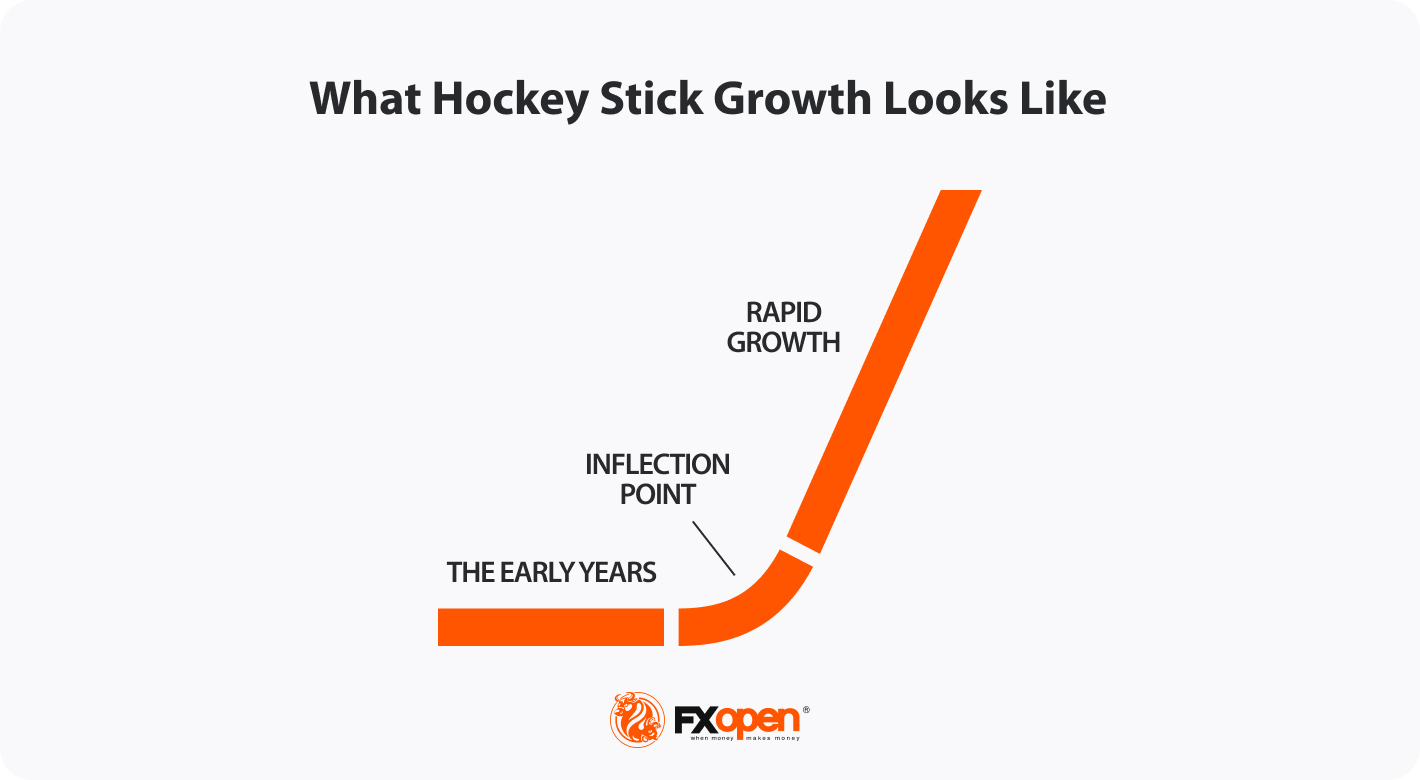
Rapid Growth: The final phase of this formation is the hockey stick growth, meaning a continuous upward trajectory and signalling a rapid exponential increase. Usually, there is a surge in trading volume during the sharp uptrend phase, which validates the strength of the formation. This curve signifies an increase in the asset's value, akin to the shaft of a hockey stick.
Duration: This can occur over varying time frames, from days to months, so traders stay vigilant across different intervals.
How to Trade the Hockey Stick Pattern
Trading this formation involves a strategic approach that traders employ to potentially capitalise on the formation's characteristics.
Entry
Traders typically consider entering a position in the “inflection phase,” as it represents an opportunity to enter a trade while the asset's price is still relatively low, but the market signals growth potential.
Take Profit
In trading the hockey stick setup, establishing a take-profit level is vital, but the pattern doesn’t provide specific levels. Market players set this target above the inflection point, considering market conditions and their risk tolerance, as a strategy to secure gains.
Stop Loss
Risk management is pivotal in trading. For the hockey stick formation, the stop-loss placement depends on the entry point. Traders entering during the “inflection phase” often set it below the “blade phase”, typically beneath initial support. If entering during the third phase, they might position the stop loss near the inflection point.
Live Market Example
To better understand how to trade this formation, let's look at a live market example using FXOpen's TickTrader platform.

Suppose you open an FXOpen account and access the TickTrader platform to analyse the daily chart of TSLA stock.
During 2017-2020, the stock had shown flat movement resembling the blade phase of a hockey stick formation. The traders had a notable opportunity to open trades in this phase to receive potential gains. The stock price was $20 at this stage. Had market players believed in the company, they might have considered entering a long position at this stage.
After “blade” years, the growth began in the initial months of 2020. The sudden rise in this stock was witnessed, with stock prices hitting $60 in the early months of 2020. A huge increase of 200% in the stock price was very convincing for traders.
Over time, the stock experienced a slight downtrend followed by the expected sharp upward curve, resembling the shaft of a hockey stick. At this stage of surging growth, the stock price reached $420. Traders that decided to open a buy position at the ‘inflection point’ near $60 must have experienced a 700% gain if they closed the position at ATH of $420.
Limitations of the Hockey Stick Pattern
While the hockey stick formation offers market players valuable insights, it's crucial to understand its limitations. Like all chart formations, the hockey stick can occasionally produce false signals. It's recommended that traders use this pattern in combination with other analytical tools to confirm signals and enhance trading accuracy.
Conclusion
The hockey stick growth chart pattern is a valuable tool for traders seeking to identify opportunities in the global financial markets. By understanding the characteristics of this formation and following a disciplined trading strategy, they can potentially capitalise on significant price increases. However, it's important to remember that no pattern or strategy is foolproof, and risk management is essential to protect capital.
This article represents the opinion of the Companies operating under the FXOpen brand only. It is not to be construed as an offer, solicitation, or recommendation with respect to products and services provided by the Companies operating under the FXOpen brand, nor is it to be considered financial advice.
Stay ahead of the market!
Subscribe now to our mailing list and receive the latest market news and insights delivered directly to your inbox.


Latest articles

XTI/USD Chart Analysis: WTI Oil Price Fluctuates Near $100
For the third Monday in a row, trading in the oil market has opened with a bullish gap, although this time it is not as wide as the gap seen, for example, on 9 March. The reason for the volatility

Gold Price Falls to a Monthly Low
As the XAU/USD chart shows, gold prices today dropped below the 3 March low, reaching levels last seen in the third week of February.
Why Is Gold Declining Despite the War?
Geopolitical turmoil typically supports demand for gold as