


Inside Bar Pattern: Basics and Strategies
FXOpen

Candlestick patterns are an important part of a comprehensive trading strategy. However, it may be difficult to choose the pattern you can rely on. In this case, traders focus on the most popular setups that have proven to work across various markets and timeframes. One of such patterns is the inside bar pattern.
In price action trading, the inside bar is often analysed as a pause in market structure, reflecting short-term volatility compression that may lead to either trend continuation or trend reversal.
In this article, we will break down the basics of the inside bar pattern, examine examples of this formation on real-market price charts, and discuss how to interpret its signals for trading purposes.
What Is an Inside Bar Candle Pattern?
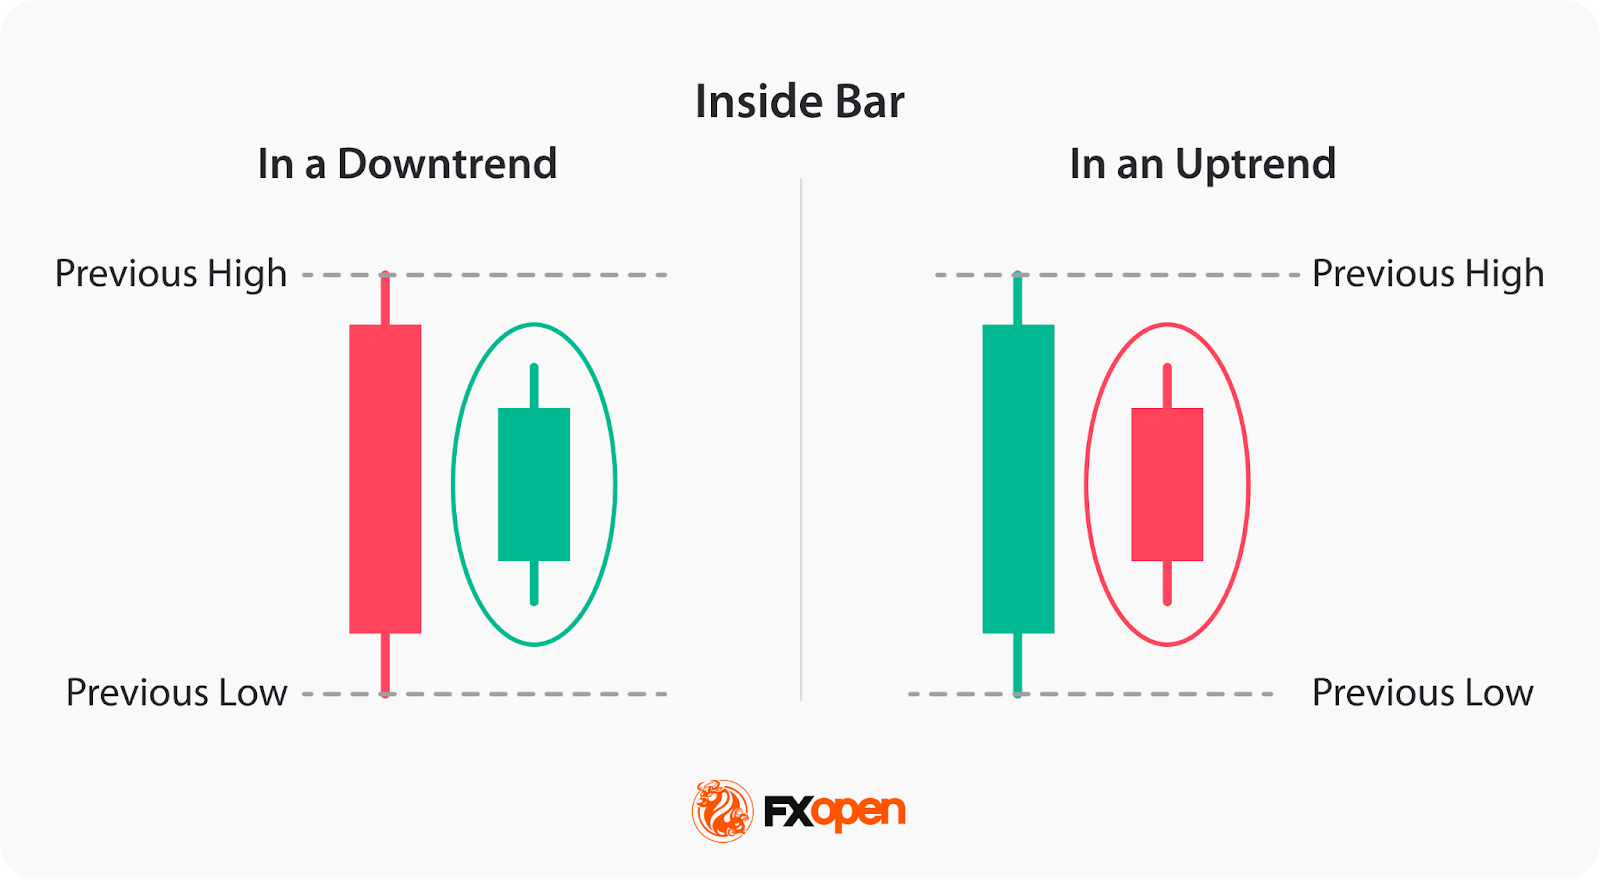
An inside bar is a neutral two-candlestick formation that signals neither trend reversal nor trend continuation and appears on a price chart when a candlestick's high and low range is contained within the high and low range of the preceding candle. In other words, the entire price action of one candle is confined within the previous candlestick's price range.
The preceding candle is commonly referred to as the mother bar, while the following candle is the inside bar itself. This formation highlights range contraction and a brief consolidation phase, where buying and selling pressure temporarily reach equilibrium.
As the pattern doesn’t signal a trend reversal or a trend continuation, the price may continue moving in the prevailing trend or turn around. The pattern may appear in both an uptrend and a downtrend.
The inside bar can be observed across different financial instruments such as stocks, cryptocurrencies*, ETFs, indices, and forex currency pairs and can be traded using contracts for difference (CFDs) provided by FXOpen. In the forex market, traders most often apply the inside bar pattern to liquid currency pairs, where higher trading volume may support trade execution.
Identifying the Inside Bar on Trading Charts
To identify this formation on trading charts, traders follow these steps:
- Look for two candlesticks: Traders start by identifying two candlesticks that look like the inside bar.
- Compare the high and low range: After that, they check if the high and low range of the subsequent candle, inside bar, is entirely contained within the high and low range of the preceding candlestick, mother bar.
- Confirm the pattern: Once they identify that the subsequent candle meets the criteria, traders confirm it as an inside bar.
The reliability of the pattern’s signals may vary by timeframe, with many traders favouring the H1, H4, or daily charts, as higher timeframes tend to filter out market noise and reduce the risk of false breakouts.
In the forex market, inside bars tend to form more frequently during lower-liquidity periods, such as the Asian session, while breakouts are more commonly observed during high-liquidity phases like the London and New York session overlap.
Many traders incorporate multi-timeframe analysis when evaluating inside bar setups. A formation that appears on a lower timeframe but aligns with a higher-timeframe trend or key level may carry more significance than a pattern that develops in isolation. For example, an inside bar forming on an hourly chart within a daily uptrend may be interpreted as a continuation signal rather than a reversal attempt, particularly when supported by broader market structure.
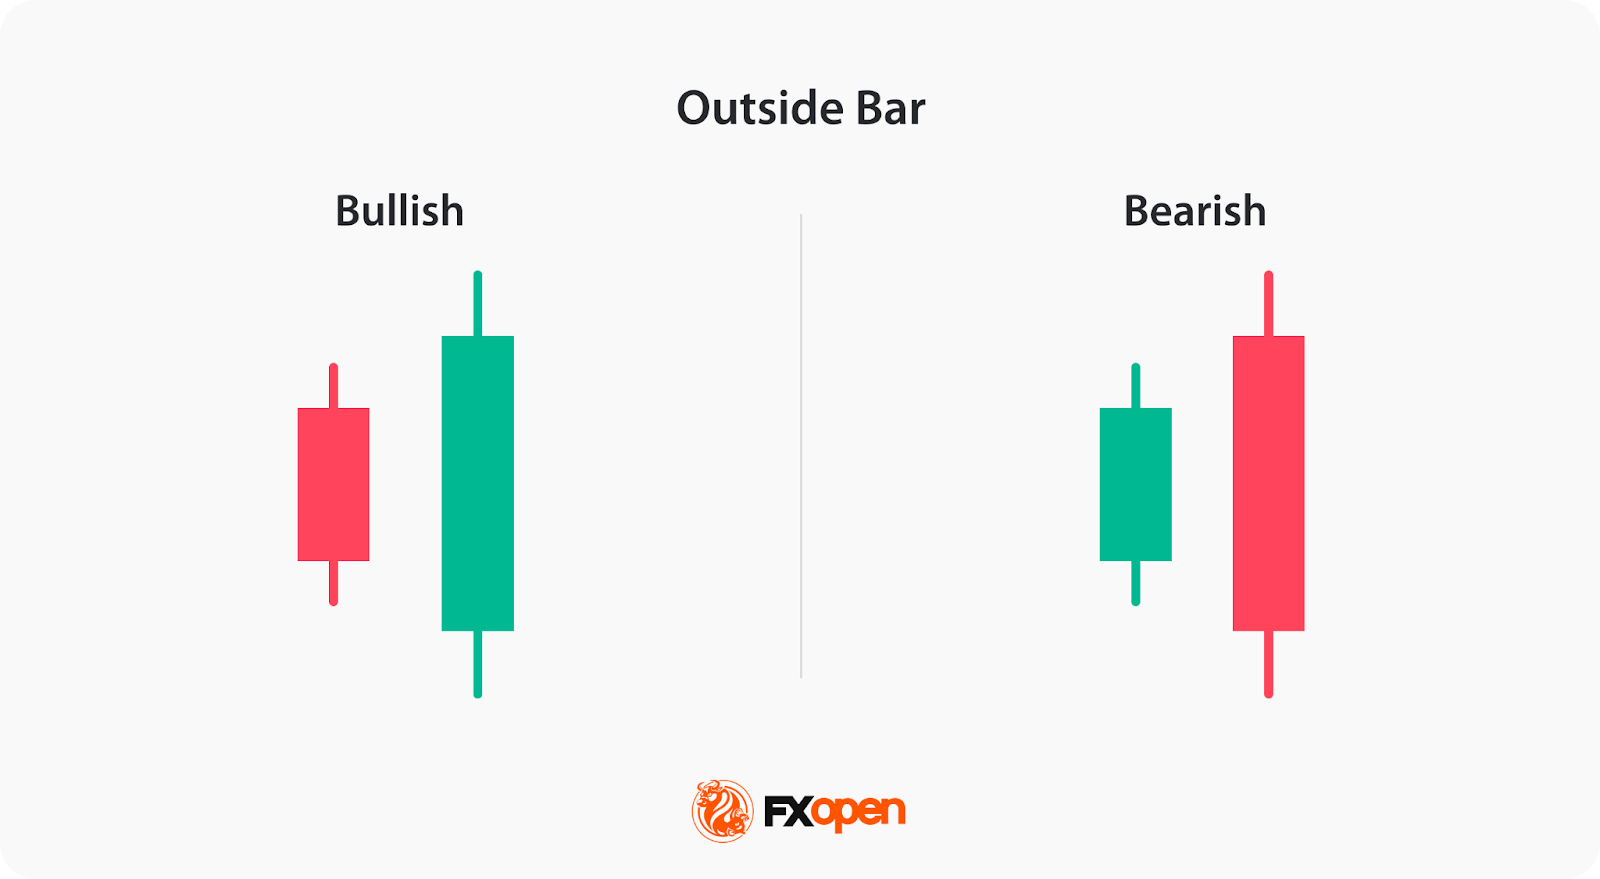
Inside Bar vs Outside Bar
The inside candle pattern occurs when the high and low of a candle are contained within the range of the preceding candlestick, indicating consolidation or indecision in the market. It suggests a potential reversal or continuation of the current trend.
On the other hand, an outside bar—often considered a form of engulfing pattern—appears when a candlestick completely exceeds the previous candle’s high–low range. As Al Brooks defines it in his Trading Price Action Trends, an outside bar occurs when “the high of the current bar is above the high of the previous bar and the low is below the low of the previous bar,” reflecting increased participation from both buyers and sellers. A bearish outside setup typically forms near the top of an uptrend and may signal a downward reversal, while a bullish outside setup forms near the bottom of a downtrend and may suggest an upward reversal.
While the inside bar reflects volatility compression and consolidation, the outside bar typically signals volatility expansion and a stronger momentum shift in price action. Both are widely used by traders for technical analysis and identifying potential trades.
Traders can analyse outside and inside bars on forex, stocks, and other markets using the FXOpen TickTrader platform.
Trading the Inside Bar Pattern
Trading with the inside bar candlestick pattern involves using it as a signal for potential breakouts or continuation of the prevailing trend. Here are the steps traders usually follow when trading with the pattern:
Determine the Direction of the Preceding Trend
Traders may use trendlines or moving averages (EMA or SMA) to define overall market bias and confirm trend direction.
When the formation develops within a strong, established trend and aligns with that trend’s direction, it is typically interpreted as a continuation setup. However, when the same structure appears after an extended directional move and forms at significant technical levels such as higher-timeframe support, resistance, or supply and demand zones, it may instead reflect trend exhaustion and potential reversal conditions. For this reason, traders evaluate both trend context and location before assigning directional bias to the pattern.
In some cases, several inside bars may form consecutively, creating a coiling pattern that reflects extended price compression and can precede a stronger volatility expansion.
Wait for a Breakout
The formation indicates consolidation and potential price compression. Traders often wait for a breakout from the setup's range to initiate a trade. A breakout above the high of the formation suggests a bullish signal, while a breakout below the low indicates a bearish signal.
However, failed or false breakouts—sometimes referred to as fakey setups—can occur when price briefly breaks the mother bar range before reversing, often due to low liquidity or weak momentum.
Breakouts that occur near key support and resistance levels confirmed by additional tools are often considered stronger. John Murphy’s Technical Analysis of the Financial Markets highlights the value of indicators such as RSI and MACD in confirming breakout strength. Low-volume moves carry a higher risk of false breakouts.
Some traders monitor these false breaks as potential reversal signals, particularly when they occur against an extended trend.
Consider Additional Confirmation
Many traders wait for 2-3 candlesticks to form in a breakout direction. Also, to avoid false breakouts, traders may look for additional confirmation indicators to support their trading decisions. An increasing volume at the breakout or a signal from a trend indicator may provide additional confluence. Common confirmation tools include Average True Range (ATR) and volume indicators, which may help assess volume and volatility conditions.
Set Their Entry Points
Traders typically apply several entry models when trading an inside bar setup. The most common approach is a breakout entry using stop orders placed beyond the high or low of the mother bar.
In trend-continuation conditions, traders may also use a break-and-retest model, entering after price closes beyond the formation and then retests the breakout level as support or resistance.
Set Stop-Loss and Take-Profit Orders
Although there are no strict rules, traders typically set stop-loss orders above the bearish and below the bullish pattern, considering the timeframe and the entry point, so they aren’t too wide. Some traders trail stops below swing highs or lows during strong trends. Monitoring volatility through tools such as ATR may also help traders determine whether to widen or tighten stops as the market transitions from consolidation to expansion.
For take-profit targets, traders might consider significant swing points or key support/resistance levels. As part of risk management, traders often apply predefined risk-to-reward ratios (such as 1:2 or 1:3) and adjust position sizing.
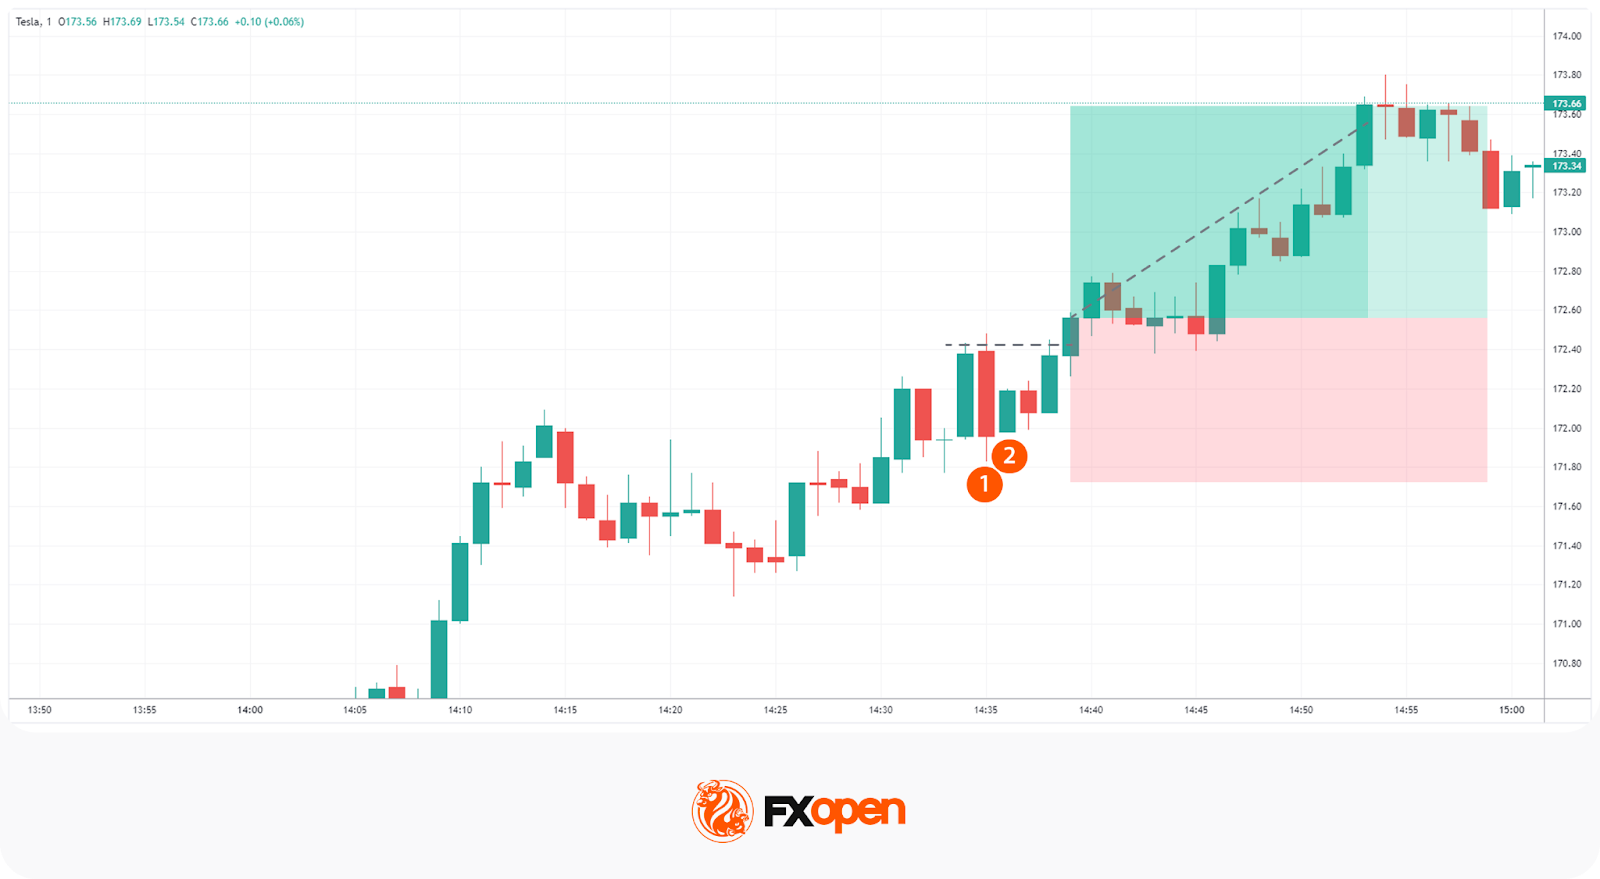
Live Market Example
Below, we provide an example of an inside bar breakout strategy with a bullish inside bar stock pattern on a Tesla chart. This setup represents a typical bullish continuation pattern, where the breakout is confirmed by candles closing above the mother bar’s high and holding above a nearby resistance level.
Following the inside bar breakout trading strategy, the trader waits for the breakout above the high of the mother bar marked by a horizontal line. The stop loss is set below the candle’s low, and the take profit is at the next resistance level.
Final Thoughts
While the inside bar pattern can be a useful tool for identifying trend reversals and continuations, it's important not to rely solely on this pattern for your trading decisions. In practice, traders often combine the inside bar with technical indicators, broader market context, and structured risk management tools to form a complete trading strategy.
If you want to develop your own trading strategy, you can use FXOpen’s TickTrader trading platform. If you have a strategy and you would like to trade it across over 700 instruments with tight spreads and low commissions (additional fees may apply), you can consider opening an FXOpen account.
FAQ
Is an Inside Bar Bullish or Bearish?
The inside bar setup does not inherently indicate a bullish or bearish bias. It simply represents a period of consolidation or market indecision. Thus, a formation in an uptrend can be bullish and signal a continuation of the trend, or bearish and signal a trend reversal. The same concept applies to a downtrend, where the indicator may be bearish and the trend will continue, or bullish and the trend will reverse.
What Does a Bullish Inside Bar Mean?
The meaning of an inside bar candle pattern that is bullish refers to the pattern, after which the price moves upwards. When this pattern forms during an uptrend, it suggests a temporary pause or consolidation before the uptrend potentially resumes. When it is formed in a downtrend, it signals a trend reversal.
What Is the Inside Bar Strategy?
In the inside bar strategy, traders wait for the pattern to form and look for a breakout above the high of the formation to enter a long position or below the low to enter a short trade. A stop-loss order might be placed below the low of the pattern in a long trade and above the high of the pattern in a short trade. Profit targets can be determined based on the trader's trading plan, technical indicators, or key support and resistance levels.
How May You Confirm an Inside Bar Signal?
As the inside bar provides both continuation and reversal signals, it is critical to confirm them. First, traders wait for the pattern to form and the following candles to close above or below it. Second, traders use volume or momentum indicators to identify the strength of the price movements. Another option is to use chart patterns that also provide continuation or reversal signals. Confirmation may also come from alignment with support and resistance or volatility conditions measured by ATR.
Are Inside Bars More Popular in Downtrends?
No, the inside bar pattern can be used in both uptrends and downtrends. No statistics can confirm that the pattern is more preferable in a downtrend. Traders can use it in their trading strategies regardless of the trend they trade in.
Which Timeframe Is Most Popular for Inside Bar Trading?
The inside bar pattern can form on any timeframe, but many traders consider it more reliable on higher timeframes, such as the H1, H4, and daily charts. Higher timeframes tend to reduce market noise and filter out minor price fluctuations, which may lower the risk of false breakouts. Lower timeframes, such as 5-minute or 15-minute charts, can also be used, but they often require stricter confirmation and more active risk management.
Is the Inside Bar a Breakout or Continuation Pattern?
The inside bar is described as a neutral consolidation pattern rather than a strictly breakout or continuation setup. It reflects a pause in price action caused by range contraction and reduced volatility. Depending on market context, an inside bar may lead to a breakout, signal a trend continuation, or occasionally precede a trend reversal.
Traders usually rely on the prevailing trend, support and resistance levels, and confirmation tools, such as momentum readings from RSI or MACD, increased volume, or volatility conditions measured by ATR, to determine how to trade the setup. However, in the Encyclopedia of Chart Patterns, Bulkowski presents that the pattern provides continuation signals in 62% of cases.
How Reliable Is the Inside Bar in Forex Trading?
The reliability of the inside bar in forex trading depends largely on market conditions and confirmation. The common required conditions for any trade are liquid currency pairs and active trading sessions, such as the London or New York sessions. When combined with tools like support and resistance, momentum indicators, and clear risk management rules, the inside bar can be a useful component of a broader trading strategy. On its own, however, it should not be treated as a guaranteed signal.
*Important: At FXOpen UK, Cryptocurrency trading via CFDs is only available to our Professional clients. They are not available for trading by Retail clients. To find out more information about how this may affect you, please get in touch with our team.
This article represents the opinion of the Companies operating under the FXOpen brand only. It is not to be construed as an offer, solicitation, or recommendation with respect to products and services provided by the Companies operating under the FXOpen brand, nor is it to be considered financial advice.
Stay ahead of the market!
Subscribe now to our mailing list and receive the latest market news and insights delivered directly to your inbox.


Latest articles

GBP/USD and EUR/GBP Await Key Bank of England Decision
The pound strengthened following the outcome of the US Federal Reserve meeting, where the central bank, as expected, kept interest rates unchanged. However, the Fed did not provide the market with clear signals of an imminent shift towards rate cuts,

Microsoft Analysis: Earnings Beat Expectations
On 29 July 2026, Microsoft reported its results for the fourth quarter of fiscal year 2026. Revenue reached $90 billion, up 18% year-on-year, while adjusted earnings per share came in at $4.74, comfortably ahead of analysts' expectations of $4.

EUR/USD: All Eyes on the Fed as the Range Reaches Its Breaking Point
The dollar's next move hinges on tonight's Fed decision, and this time markets genuinely don't know what to expect. While economists still lean toward a hold—with CME FedWatch odds sitting near 68.5% for no change—Kevin Warsh's hawkish