


FXOpen
Price action analysis serves as a pivotal methodology in financial markets, offering a means to assess and determine the future price movements of various assets, including stocks, currencies, and commodities. Among the many tools employed within this method, the Island Reversal pattern stands out as a significant indicator of potential trend reversals.
What Is an Island Reversal Pattern?
The Island Reversal is a technical analysis pattern that signals a potential trend reversal. It typically occurs after a strong uptrend or downtrend and is characterised by a gap in price action, isolating a group of candlesticks. The pattern suggests a shift in market sentiment, indicating that the previous trend may be losing momentum.
How to Spot an Island Reversal in the Chart
To identify the setup, traders pay close attention to the following characteristics, which can manifest in both bullish and bearish market conditions:
Strong Trend:
- Bullish: This pattern often materialises after a prolonged downtrend. It signifies a potential price change to the upside.
- Bearish: Conversely, in a bullish market, the pattern emerges following a sustained uptrend, suggesting a possible change in a trend to the downside.
Gap in Island Reversal:
- Bottom Island Reversal: In a bullish context, there is a gap down, creating an "island" of isolated candlesticks, indicating a shift from bearish sentiment to potential bullish momentum.
- Top Island Reversal: For a bearish reversal, there is a gap up, isolating a group of candlesticks, signalling a transition from bullish to potentially bearish market sentiment.
Isolation:
- Bullish Island Reversal: The gap is created by an upward movement that is isolated from the surrounding price action, forming the characteristic island formation.
- Bearish Island Reversal: In a bearish context, the gap is formed by a downward movement that does not overlap with the previous, creating a distinctive island formation.

How to Trade the Island Reversal
Traders employing the setup adhere to a systematic strategy for identifying and capitalising on a potential change in a trend. Patiently awaiting confirmation of the reversal through subsequent price action, traders enter the market upon the break of isolation, where the price decisively moves below (for a bearish scenario) or above (for a bullish scenario) the isolated island. Profit targets may be set by considering key support and resistance levels to potentially enhance precision.
The placement of stop-loss orders just above or below the pattern is a critical risk management component. Traders carefully assess the risk-reward ratio to align potential profits with associated risks. This holistic approach reflects a commitment to disciplined decision-making, combining technical analysis and prudent risk management in navigating the complexities of financial markets.
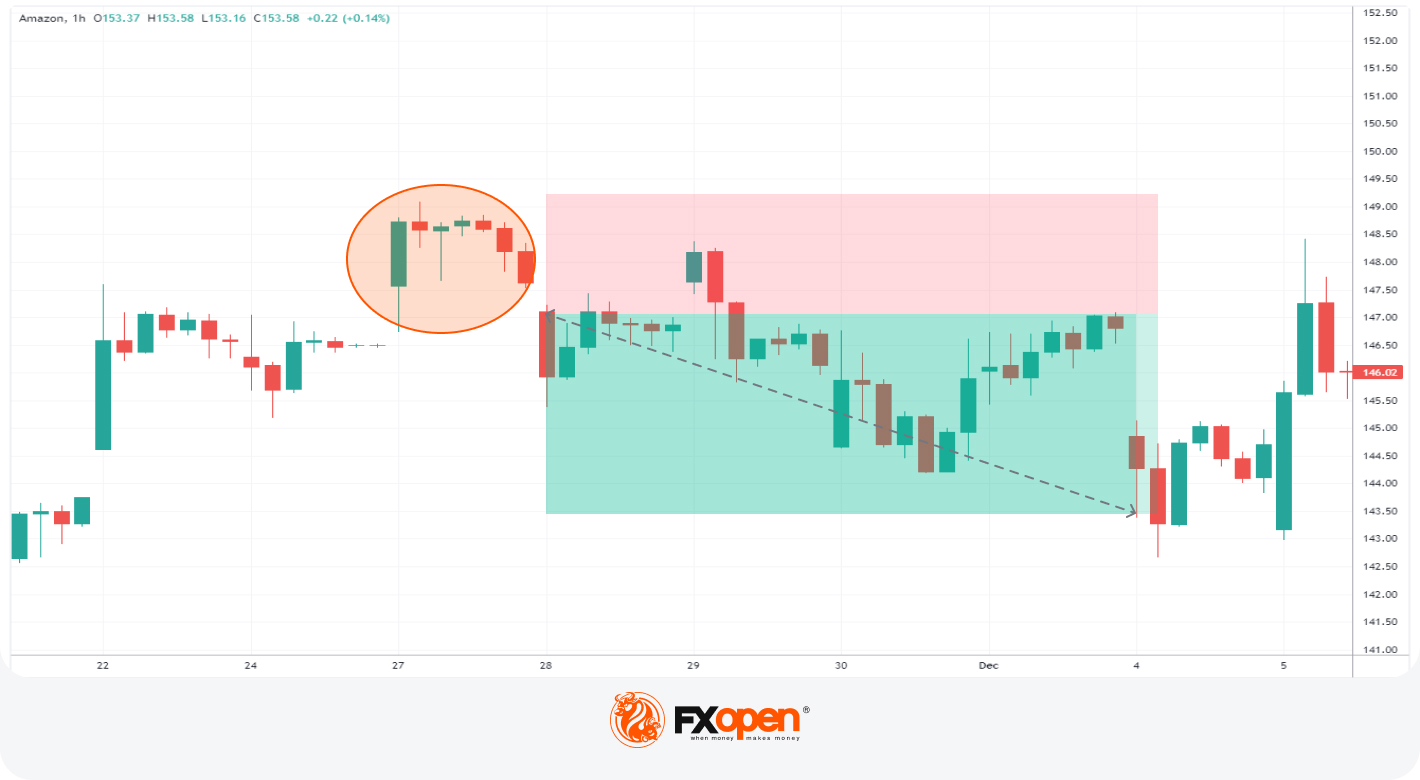
Live Market Example
The TickTrader chart by FXOpen below shows a bearish setup. The trader takes the short at the opening of the new candle below the Island. Their stop loss is above the setup with a take profit at the next support level.
The Bottom Line
Although the Island Reversal is a popular technical analysis tool, it's crucial to wait for confirmation and consider other technical indicators to potentially increase the probability of an effective trade. As with any trading strategy, risk management is key to mitigating potential losses. Always adapt your approach based on the specific conditions of the market and use the pattern as one of several tools in your trading arsenal. To develop your expertise, open an FXOpen account to trade in numerous markets with exciting trading conditions.
FAQs
Why Is Risk Management Important When Trading the Island Reversal?
The pattern is considered a strong signal of a change in the price direction, but like all technical patterns, it is not infallible. There is always a risk that the pattern may fail to lead to the expected price movement. Effective risk management helps limit losses in case the trade doesn't play out as anticipated.
Should Traders Solely Rely on the Island Reversal for Trading Decisions?
No, traders always wait for confirmation and incorporate other technical indicators to potentially enhance the probability of an effective trade. The pattern should be regarded as just one of several tools in a trader's toolkit.
Is There a Platform Where Traders Can Apply Their Knowledge of the Pattern in Live Markets?
Yes, traders can explore FXOpen’s free TickTrader trading platform to trade in over 600 markets and apply their understanding of the pattern in practical trading scenarios.
This article represents the opinion of the Companies operating under the FXOpen brand only. It is not to be construed as an offer, solicitation, or recommendation with respect to products and services provided by the Companies operating under the FXOpen brand, nor is it to be considered financial advice.
Stay ahead of the market!
Subscribe now to our mailing list and receive the latest market news and insights delivered directly to your inbox.


Latest articles


Market Insights with Gary Thomson: Oil, US Retail Sales & NFP in Focus
In this video, we’ll explore the key economic events and market trends, shaping the financial landscape. Get ready for insights into financial markets to help you navigate the week ahead. Let’s dive in!
In this episode of Market

Geopolitics Fuels Volatility: AUD/USD and USD/CAD Near Key Levels
Commodity-linked currencies continue to weaken amid rising geopolitical tensions, which are boosting demand for safe-haven assets and increasing volatility across both FX and commodity markets. The US dollar is gaining support from demand for liquid and defensive assets, while currencies