


FXOpen

Analysing price movements and identifying trends are crucial aspects of financial markets, and traders often rely on trading indicators and candlestick patterns for informed decision-making. In the realm of trading, the On-Neck pattern may serve as a significant setup for traders. This article delves into the understanding of the On-Neck pattern in trading and explores its strategic implications.
What Is an On-Neck Pattern?
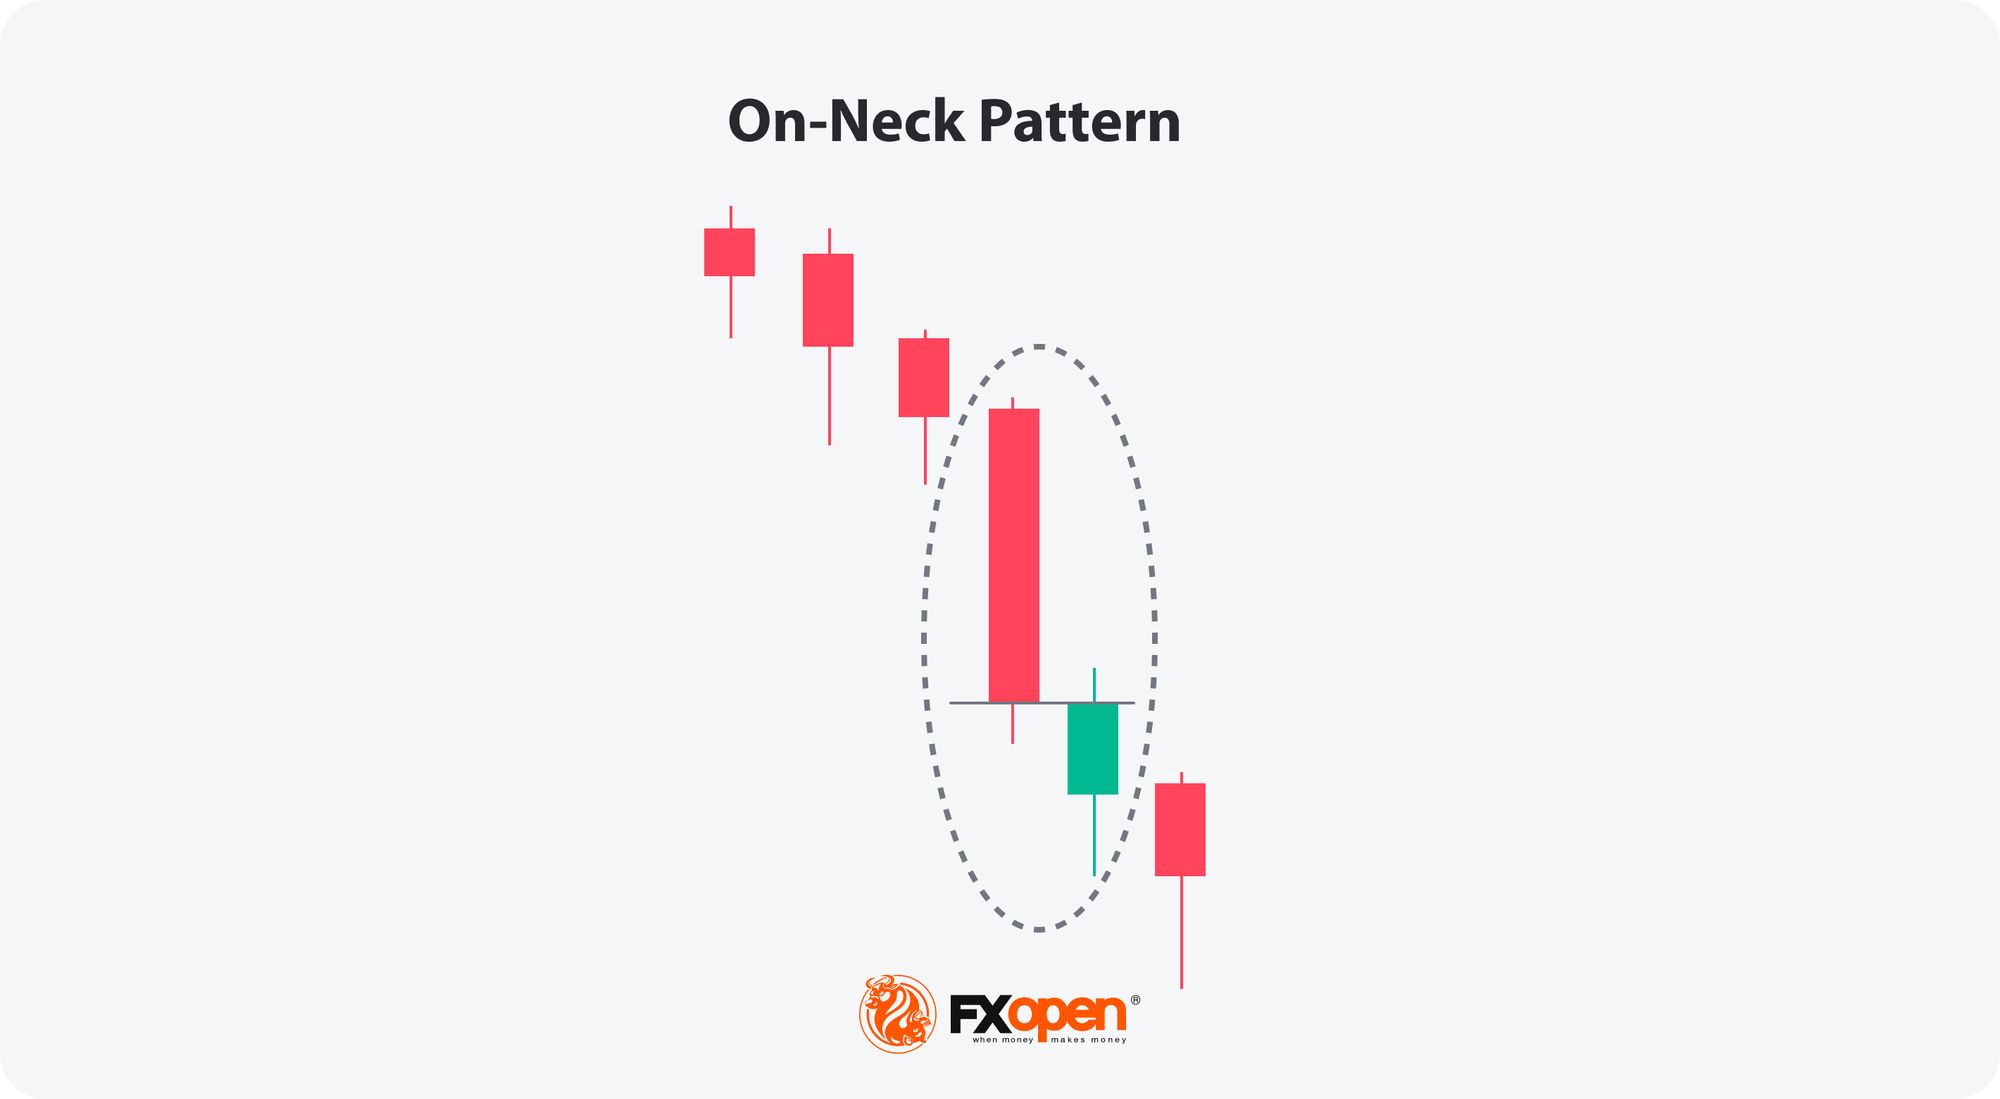
The On-Neck is a two-candlestick formation that usually appears in a downtrend and signals a trend continuation. It consists of a tall down candle followed by a shorter one that gaps down on the open but closes at or near the previous candle’s close. The term "On-Neck" refers to the horizontal line formed by the identical or nearly identical closing prices of the two candlesticks, resembling a neckline.
How to Spot an On-Neck Pattern in the Chart
Identifying the formation involves the following steps:
- Downtrend: Look for a prevailing downward trend.
- First Candle: Find a tall bearish candlestick representing selling pressure.
- Second Candle: Look for a bullish candlestick that gaps down on the open but closes near the previous candle’s close, forming a horizontal neckline.
How to Trade the On-Neck Pattern
Here is how traders may enter a position:
- Enter a short position when the formation is confirmed.
- Confirmation requires the second candlestick to close near the previous one’s close and one more bearish candle to be formed.
Here are some considerations for a take-profit target:
- You may consider taking profits when the price approaches a support level or technical indicators signal a trend reversal.
- You may set a stop-loss order to manage potential losses. You may place the stop loss above the formation or above the closest resistance level.
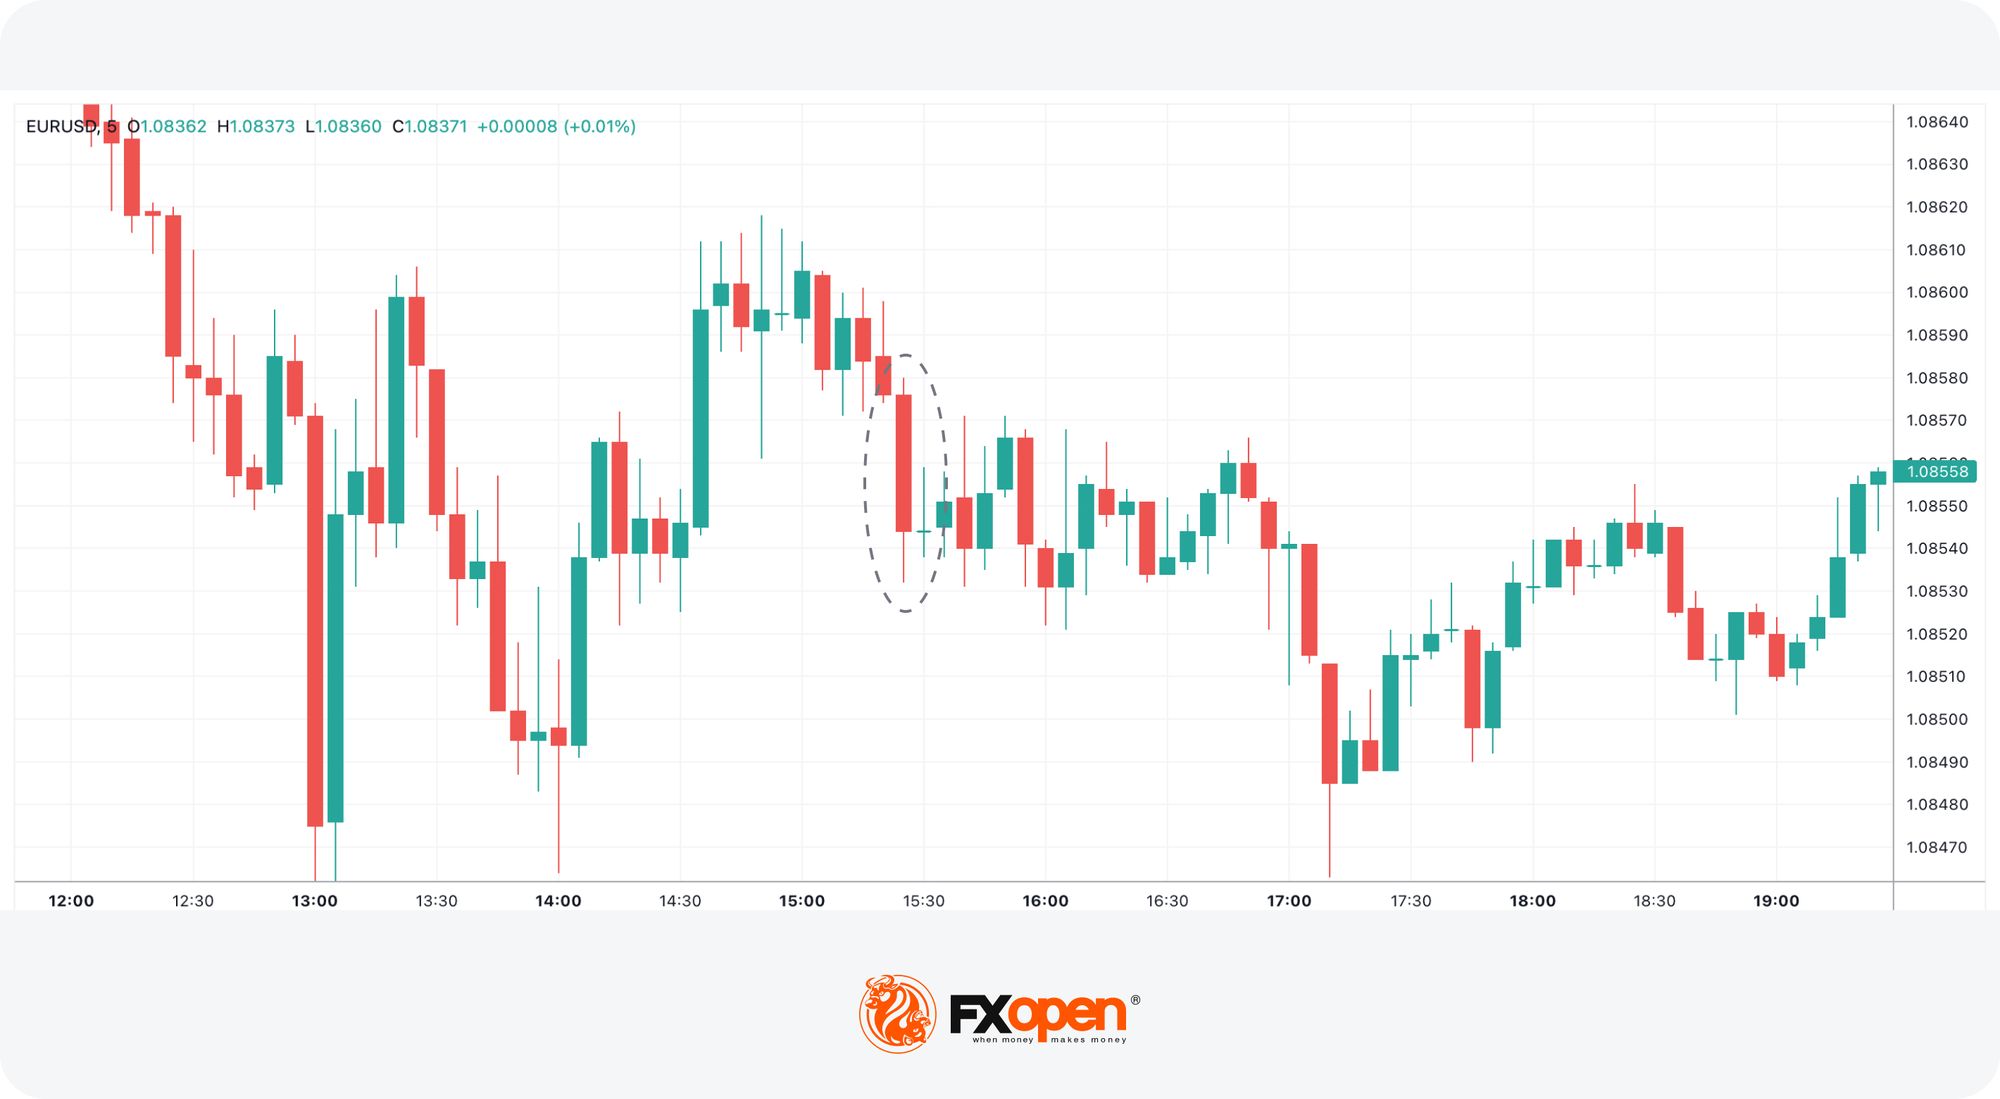
This is an example of the On-Neck pattern on the TickTrader chart by FXOpen. A trader could open a sell position once the first bearish candle formed after the pattern.
On-Neck vs In-Neck Formation
The On-Neck and In-Neck are two similar two-line continuation candlestick setups, but they have a difference:
- On-Neck: The second candle closes at or near the previous one’s close, indicating a more intense bearish trend.
- In-Neck: The second candle closes slightly higher than the prior one’s closing price, suggesting a less severe bearish trend.
Final Thoughts
Traders should exercise caution and consider additional technical indicators for confirmation while trading this setup. Entry, take-profit, and stop-loss points are essential for effective risk management when trading with this formation. Always be mindful of market conditions when implementing a particular trading strategy. As you develop a solid trading approach or want to trade with this setup, consider opening an FXOpen account to assess trading in over 600 markets with tight spreads and low commissions.
FAQ
What Is the Significance of the On-Neck Pattern in Trader Psychology?
The On-Neck formation in trader psychology often indicates a struggle between bears and bulls. It reflects a bearish sentiment, but the subsequent price action can lead to uncertainty and indecision among traders.
How Can the On-Neck Be Applied in Forex Trading?
The On-Neck forex trading pattern serves as a valuable indicator of a trend continuation. The setups’ characteristics offer insights into market sentiment, assisting traders in making more informed trading decisions when trading in a downtrend.
What Are Effective Forex Trading Strategies Involving the On-Neck?
Traders can employ various On-Neck forex trading strategies when trading in trends. However, it’s important to remember to confirm signals with additional technical indicators. Also, it's crucial to consider the overall market context and risk management principles when implementing these strategies.
How Can I Learn to Use the On-Neck Forex Trading Pattern?
To utilise this setup effectively, traders:
- Look for an established downtrend.
- Confirm the formation with the candlestick closing down after the formation.
- Consider entering short positions based on the confirmation.
- Implement risk management measures, including setting stop-loss and take-profit levels.
Can the On-Neck Pattern Be Used with Other Trading Indicators?
Yes, integrating this setup with other technical indicators may enhance trading decisions. Traders often combine this formation with tools like moving averages and the RSI to strengthen their analysis and increase the probability of effective trades.
Is the On-Neck Reliable in Forex Trading?
While it can provide valuable insights, it's essential to acknowledge that no setup guarantees success. Traders should use patterns as part of a comprehensive analysis, considering market conditions and employing risk management strategies for a well-rounded approach.
This article represents the opinion of the Companies operating under the FXOpen brand only. It is not to be construed as an offer, solicitation, or recommendation with respect to products and services provided by the Companies operating under the FXOpen brand, nor is it to be considered financial advice.
Stay ahead of the market!
Subscribe now to our mailing list and receive the latest market news and insights delivered directly to your inbox.


Latest articles


Market Insights with Gary Thomson: Oil, US Retail Sales & NFP in Focus
In this video, we’ll explore the key economic events and market trends, shaping the financial landscape. Get ready for insights into financial markets to help you navigate the week ahead. Let’s dive in!
In this episode of Market

Geopolitics Fuels Volatility: AUD/USD and USD/CAD Near Key Levels
Commodity-linked currencies continue to weaken amid rising geopolitical tensions, which are boosting demand for safe-haven assets and increasing volatility across both FX and commodity markets. The US dollar is gaining support from demand for liquid and defensive assets, while currencies