


Triple Top Pattern in Trading: Signals and Strategies
FXOpen

The triple top is a well-known bearish reversal pattern that traders use to spot potential shifts in market direction. Formed after three unsuccessful attempts to break through a resistance level, it can indicate weakening momentum and the possibility of a downward move.
In this article, we’ll explain what the triple top trading pattern is, what it signals, and how to recognise it on price charts. You’ll also find examples to illustrate how it might be applied within a trading strategy.
What Is a Triple Top Pattern?
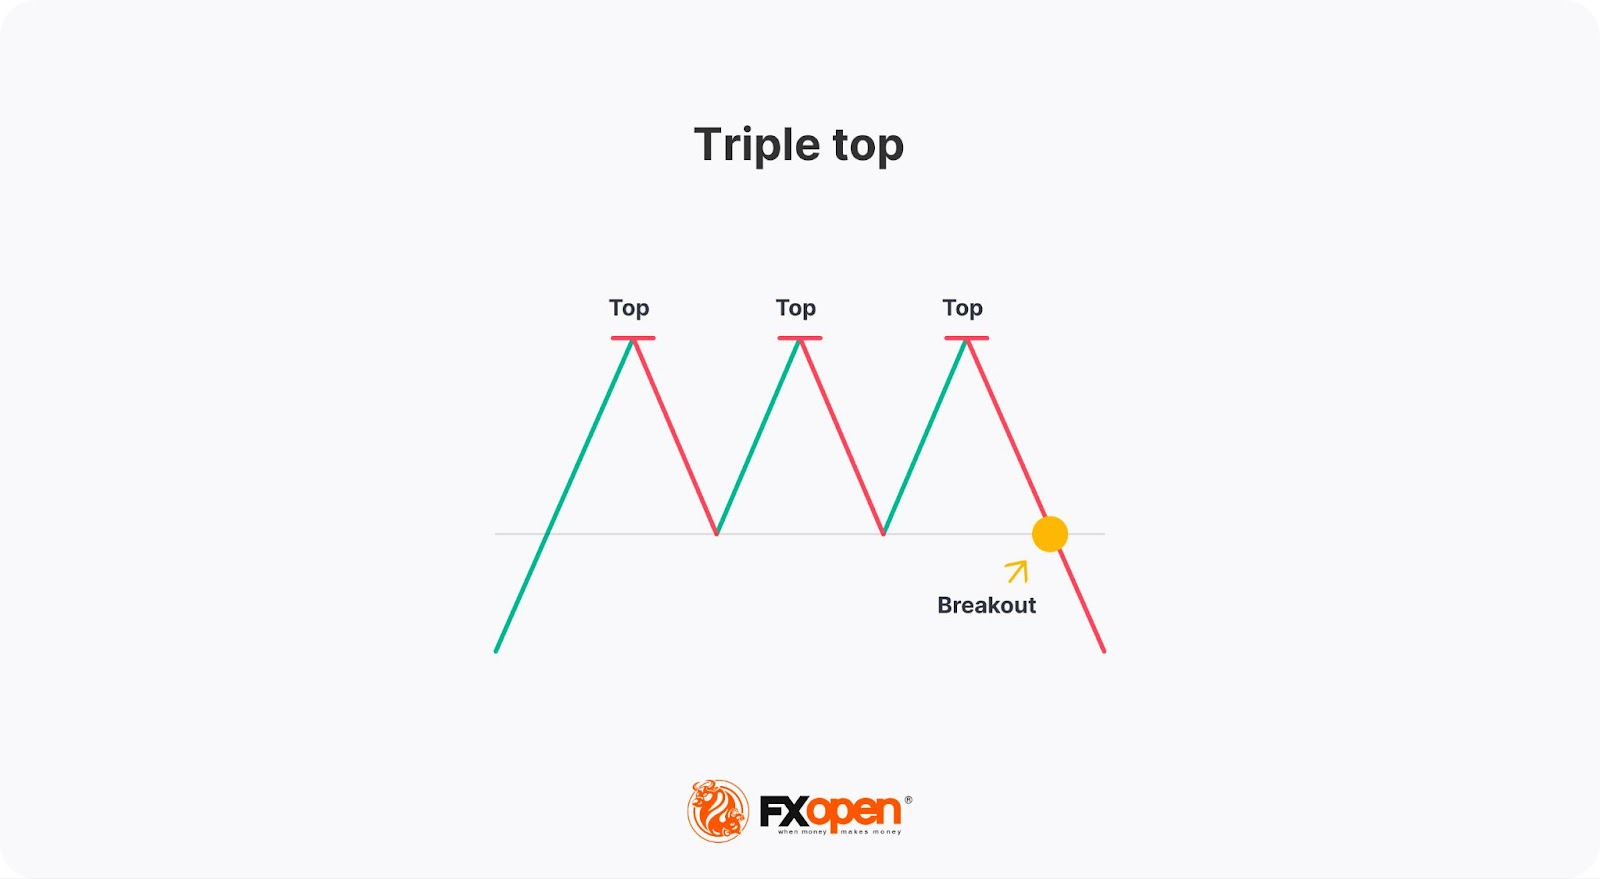
A triple top is a technical analysis pattern that signals a potential downward reversal in a trend. The pattern occurs when the price of an asset hits the same resistance level three times, failing to break above it on each occasion. This indicates that buyers are losing strength and sellers are starting to dominate the market. It is often seen after a sustained uptrend.
Identifying a triple top involves spotting three distinct peaks at roughly the same price level, separated by two troughs. The peaks are formed when the price hits resistance but fails to push through, while the troughs occur when the price retraces after each failed attempt.
To confirm a valid triple top, the peaks should be close in height, and the troughs should create a roughly horizontal neckline. The pattern is confirmed when the price breaks below the neckline, signalling that sellers have overtaken buyers.
Triple Top Chart Pattern Trading Strategy
Once traders have identified the triple top formation, they can use various trading strategies to take advantage of it. However, there are common rules that are used as the basis:
- Entry: Traders enter a short position when the price breaks below the neckline, which is the level that connects the two troughs that separate the peaks. This level is a critical support level, and when it is broken, it confirms the triple top candlestick pattern and indicates that the trend is reversing.
- Stop Loss: To manage risk, traders place a stop-loss order above the neckline. If the price starts to rise again, the stop-loss order will limit potential losses. The theory states that traders can place a stop-loss on the neckline. However, the price often retests the support level after a breakout, so the risk of an early exit rises.
- Take Profit: There are several ways of determining a profit target. The most common technique is to measure the distance between the tops and bottoms and subtract it from the triple top breakout point.
Another strategy is to identify the target based on the closest support levels. However, this may limit potential returns if the support is too close to the entry point. Therefore, traders sometimes use trailing stops to lock in potential profits as the price continues to fall.
Trading Example
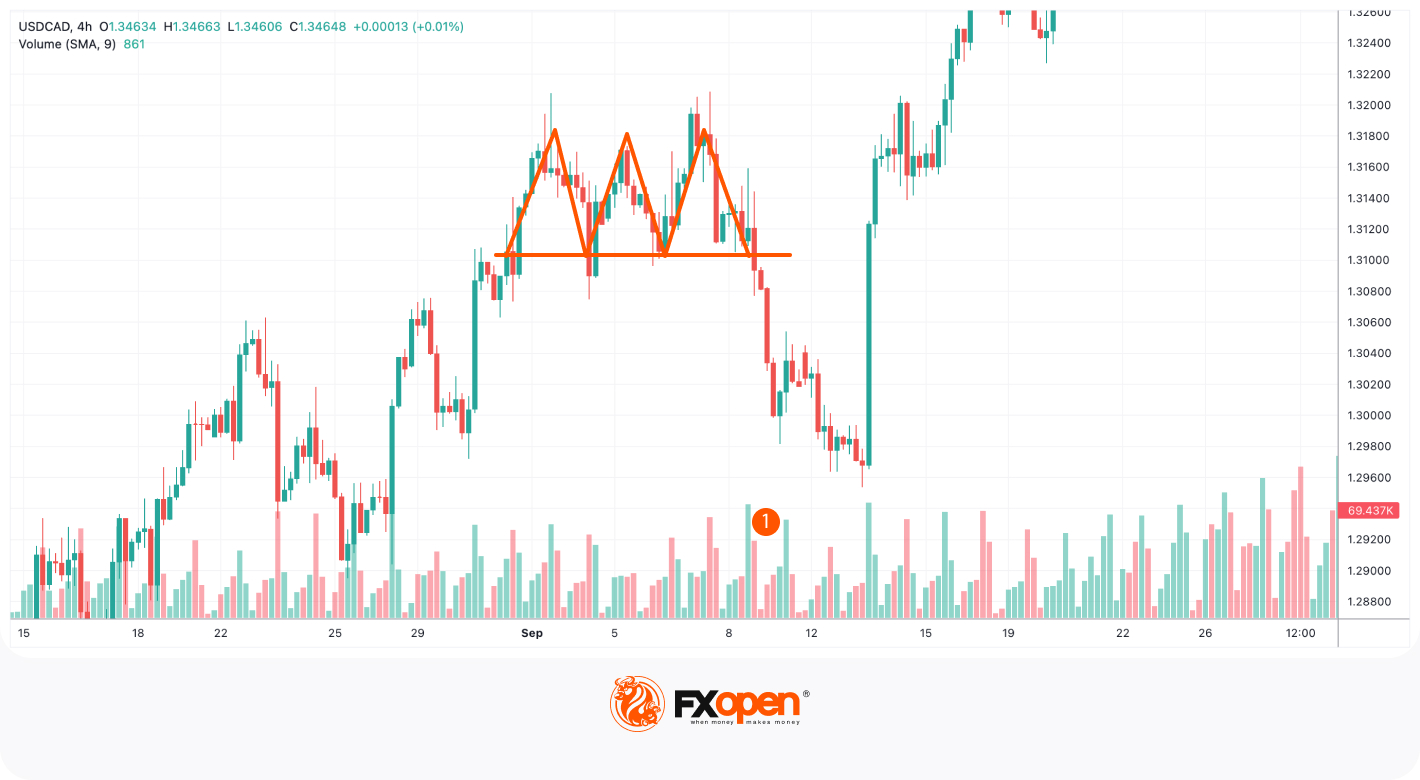
In the chart above, the price formed the triple top. We could have entered a short position once the price broke below the neckline and closed it either at the point equal to the distance between the peaks and the neckline or at the closest support level, as the levels are almost equal. However, selling volumes were low (1) at the breakout level, so we could have expected an upcoming bullish reversal. Therefore, we wouldn’t have kept the position beyond the initial take-profit target.
How Traders Confirm the Triple Top
To confirm the triple top pattern and ensure its validity, traders typically use a combination of technical tools and indicators. These may help confirm that the trend is indeed reversing and not just experiencing a temporary pullback. Here are some of the methods traders use:
- Neckline Break. The most important confirmation comes when the price breaks below the neckline, which is the horizontal level connecting the lows between the peaks. A clean break suggests a stronger reversal.
- Volume Analysis. Volume plays a crucial role in confirming the triple top. Traders look for a surge in selling volume when the price breaks the neckline. If the volume is low during the breakout, the pattern may not be reliable, and a bullish reversal could follow.
- Momentum Indicators. Traders often use momentum indicators like the Stochastic Oscillator or Moving Average Convergence Divergence (MACD). When these indicators show bearish divergence, it signals a potential downward reversal. A negative crossover in the MACD or Stochastic adds further confirmation.
- Retest of Neckline. Sometimes, after breaking the neckline, the price may retrace and retest this level as resistance. A failed retest, where the price does not move back above the neckline, confirms that sellers are in control.
However, this isn’t a comprehensive list; you can test different indicators on the TickTrader platform to determine the one that will validate the triple top formation.
What Is the Difference Between Triple Top and Triple Bottom?
It is important to distinguish between the triple top and the triple bottom chart patterns, as the former is the bearish setup, while the latter is a bullish reversal formation. The triple bottom setup forms when the price hits a particular support level three times and fails to break through it. It suggests that the sellers have lost their strength, and the buyers are starting to take control. The bottoms are separated by two peaks, which occur when the price retraces some of its gains from the support level.

Traders use the same principles to trade the triple bottom as they would the triple top but vice versa. They enter a long position when the price breaks above the neckline and set a stop-loss order below it. The take-profit target might equal the distance between bottoms and peaks or be set at the closest resistance level.
Triple Top Challenges
While the triple top pattern is a valuable tool for spotting reversals, it has its limitations. Traders should be aware of the following challenges:
- False Breakouts. The price may break below the neckline only to quickly reverse back, leading to a false signal. This can cause traders to enter losing positions if they act too quickly without further confirmation.
- Extended Sideways Movement. Sometimes, the price can stay near the neckline after a breakout, leading to indecision and uncertain market behaviour. This sideways movement can make it difficult to determine if the trend has truly reversed.
- Retests Leading to Reversals. After the initial breakout, the price may retest the neckline and move back above it, invalidating the triple top pattern. Some traders set stop-loss orders to potentially mitigate risk.
Final Thoughts
The triple top is a classic bearish reversal pattern that may help traders recognise when upward momentum is losing strength. By identifying it, traders can gain insight into potential market reversals. While the pattern can be a useful part of technical analysis, traders usually combine it with other tools, like trend-strength indicators. Understanding how to spot and apply the triple top can provide a structured approach to analysing market trends.
If you want to trade with the triple top pattern, you may consider opening an FXOpen account and trade with tight spreads, low commissions, and advanced trading platforms.
FAQ
What Does a Triple Top Mean in Trading?
The triple top pattern meaning refers to a bearish reversal formation indicating a potential end to an uptrend. It forms when the price reaches the same resistance level three times without breaking through, suggesting weakening buying momentum and increasing selling pressure. This pattern signals that the asset's price may soon decline.
How May Traders Confirm the Triple Top Pattern?
According to theory, to confirm a triple top pattern, traders watch for a decisive break below the neckline, which connects the lows between the peaks. Increased trading volume during the breakout strengthens the confirmation, indicating strong seller interest. Technical indicators like the Stochastic Oscillator showing bearish divergence can provide additional validation.
Is a Triple Top Bullish or Bearish?
A triple top is a bearish reversal pattern. It signifies that the asset's price has repeatedly failed to surpass a resistance level, indicating diminishing upward momentum. Traders see this as a cue to consider short positions or to exit existing long positions.
Is a Triple Top Stronger Than a Double Top?
A triple top is generally considered stronger than a double top pattern because the price has failed to break resistance three times instead of two. This extra failed attempt reinforces the strength of the resistance level and increases the likelihood of a significant reversal. However, both patterns are important and should be analysed with other market factors.
This article represents the opinion of the Companies operating under the FXOpen brand only. It is not to be construed as an offer, solicitation, or recommendation with respect to products and services provided by the Companies operating under the FXOpen brand, nor is it to be considered financial advice.
Stay ahead of the market!
Subscribe now to our mailing list and receive the latest market news and insights delivered directly to your inbox.


Latest articles

Weekly Market Insights with Gary Thomson: The Week of Central Banks and Earnings
In this video, we’ll explore the key economic events and market trends, shaping the financial landscape. Get ready for insights into financial markets to help you navigate the week ahead. Let’s dive in!
In this episode of Market

Intel at a Crossroads: Earnings Beat Meets Technical Resistance
Intel has just delivered its strongest quarter in over fifteen years, and the market reaction says it all. Q2 2026 revenue surged 25% year-over-year to $16.1 billion, crushing the consensus estimate of $14.42 billion, while adjusted EPS of

Tesla: Complex Range Structure Breaks Down Following Quarterly Earnings
Tesla released its Q2 2026 results after the market closed on 22 July. Revenue increased 26% year-on-year to $28.24 billion, while vehicle deliveries reached a record 480,126 units. However, operating margin fell sharply to 1.4%, down from