


How to Trade with Three Inside Up/Down Candlestick Patterns
FXOpen

The three inside up and down patterns are three-candlestick formations that signal a potential trend reversal. They may hold immense value for traders and analysts as they unveil potential trading opportunities. In this article, we will explore various instances of this setup on price action charts, offering valuable insights into effectively interpreting its signals.
What Are Three Inside Up and Down Patterns?
The three inside up pattern appears before an uptrend is replaced with a downtrend. It consists of three successive candlesticks – the first is long and bearish and is followed by a smaller bullish bar that is completely engulfed by the first one. The third candle is bullish and closes above the second candle's high, suggesting a potential shift from a downtrend to an uptrend.

The three inside up formation
On the other hand, the three inside down is a bearish setup with three candles. The first is a long bullish bar, followed by a smaller bearish one that is engulfed by the first candle. The third is a bearish bar that closes below the low of the second one, indicating a possible transition from an uptrend to a downtrend. FXOpen enables traders to trade both up and down formations on various financial instruments through contracts for difference (CFDs*).
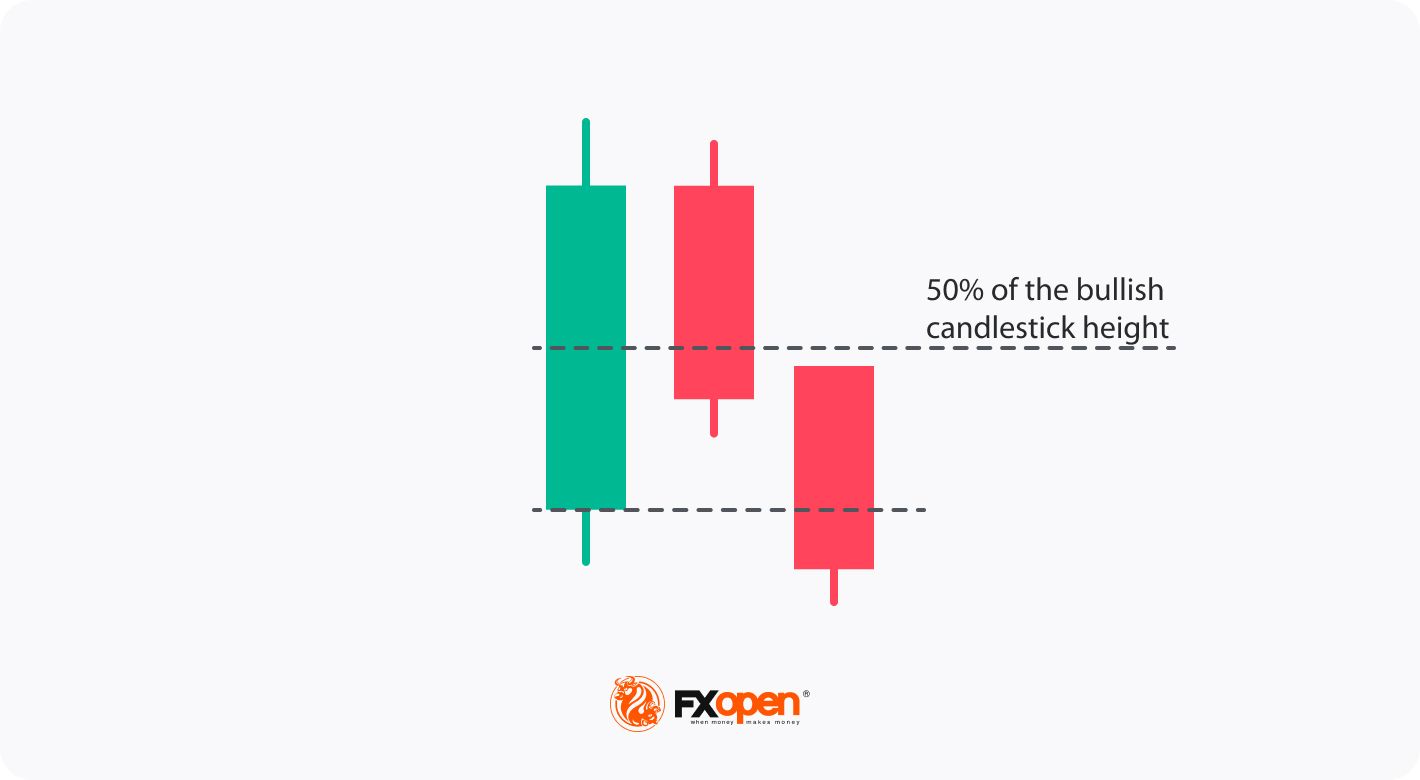
Three inside down reversal candlestick pattern formation.
By leveraging the FXOpen TickTrader platform, traders can freely analyse these setups on various assets and timeframes. Traders can delve into the intricacies of these setups, facilitating comprehensive analysis at no cost.
Identifying 3 Inside Up and Down
To identify the 3 inside up candlestick formation, traders may follow these steps:
- Look for a bearish trend in the charts.
- Find a long bearish bar representing a significant downward move.
- The next candlestick should be a smaller bullish bar that is completely engulfed by the previous candle.
- Finally, observe a bullish candlestick that closes above the high of the second bar, confirming a strong uptrend.
A three upside down formation may be observed as follows:
- Identify an existing uptrend in the price chart.
- Spot a long bullish bar, indicating a substantial upward movement.
- The subsequent bar should be a smaller bearish one that is engulfed by the previous candle.
- Confirm the three inside down candle pattern by observing a bearish candle that closes below the low of the second candle.
How to Trade the Patterns
Traders usually use the following steps to trade the 3 inside up bullish reversal pattern:
- Confirmation: Identify a prevailing downtrend and identify the formation.
- Entry: Place a buy order above the third bar’s high to confirm the bullish turnover.
- Stop-loss: Set a stop-loss order below the low of the first bar to manage risks.
- Take-profit: Consider setting a profit target based on technical analysis, such as a previous resistance level or a measured move.
- Monitor: Keep an eye on price action and adjust the stop-loss and take-profit levels as the trade progresses.
The steps for trading the three inside down pattern are generally as follows:
- Confirmation: Identify an existing uptrend and locate the setup.
- Entry: Place a sell order below the third bar’s low to confirm the bearish turnover.
- Stop-loss: Set a stop-loss order above the first candlestick’s high to limit potential losses.
- Take-profit: Determine a suitable profit target based on technical analysis, such as a previous support level or a measured move.
- Monitor: Continuously monitor a trade, making adjustments to the stop-loss and take-profit levels as necessary.
Live Market Example
We will look at the up formation on the USDJPY chart. The trader enters a trade at the opening of the candle that follows the three inside up and places a stop-loss order below the first bar’s low and a take-profit level at the closest resistance level.

The forex three inside down pattern is reflected on the GBPUSD pair’s chart. The trader places the sell order below the third bar and takes profit at the closest support with a stop-loss order above the high of the first bar.

Final Thoughts
While the three inside down/up formations can offer valuable indications of a trend reversal, traders don’t solely rely on them for trading decisions. It is essential to supplement these setups with technical indicators, employ effective risk management strategies, and exercise caution. Traders must be aware of false signals and adapt their strategies accordingly. Traders may open an FXOpen account to apply their approach in live trading once they have gained confidence in their trading method.
FAQs
What is the three inside up candlestick pattern?
The three inside up candlestick pattern is a bullish reversal pattern that consists of three consecutive candles. The first candle is bearish, followed by a second bullish candle that is completely engulfed by the first candle. The third candle is also bullish and closes above the high of the second candle, confirming the bullish reversal signal.
What do the three inside up and down patterns indicate in terms of market sentiment?
The three inside up pattern suggests a shift from bearish to bullish sentiment. It indicates that buyers have gained control of the market, potentially leading to further upward price movement. Conversely, the three inside down pattern suggests a transition from bullish to bearish sentiment. It signifies that sellers have taken control after an uptrend, possibly resulting in a downward price movement.
Can three inside up/down candlestick patterns be applied to any timeframe?
Yes, three inside up/down candlestick patterns can be applied to various timeframes, ranging from short-term intraday to longer-term daily or weekly charts. Traders can adapt these patterns to suit their preferred trading timeframe and incorporate them into their analysis to identify potential reversal signals accordingly.
*At FXOpen UK and FXOpen AU, Cryptocurrency CFDs are only available for trading by those clients categorised as Professional clients under FCA Rules and Professional clients under ASIC Rules, respectively. They are not available for trading by Retail clients.
This article represents the opinion of the Companies operating under the FXOpen brand only. It is not to be construed as an offer, solicitation, or recommendation with respect to products and services provided by the Companies operating under the FXOpen brand, nor is it to be considered financial advice.
Stay ahead of the market!
Subscribe now to our mailing list and receive the latest market news and insights delivered directly to your inbox.


Latest articles

GBP/USD and EUR/GBP Await Key Bank of England Decision
The pound strengthened following the outcome of the US Federal Reserve meeting, where the central bank, as expected, kept interest rates unchanged. However, the Fed did not provide the market with clear signals of an imminent shift towards rate cuts,

Microsoft Analysis: Earnings Beat Expectations
On 29 July 2026, Microsoft reported its results for the fourth quarter of fiscal year 2026. Revenue reached $90 billion, up 18% year-on-year, while adjusted earnings per share came in at $4.74, comfortably ahead of analysts' expectations of $4.

EUR/USD: All Eyes on the Fed as the Range Reaches Its Breaking Point
The dollar's next move hinges on tonight's Fed decision, and this time markets genuinely don't know what to expect. While economists still lean toward a hold—with CME FedWatch odds sitting near 68.5% for no change—Kevin Warsh's hawkish