


Heikin Ashi Charts: What They Are and How They May Be Used
FXOpen
Heikin Ashi charts are used by traders to filter market noise and reveal the underlying trend. In this article, we explain how these modified candlesticks are calculated, how they differ from standard charts, and how traders apply patterns in their trading strategies to identify trend reversals and continuation setups.
Heikin Ashi Candles Explained
What are Heikin Ashi candles? This charting technique was created by Japanese merchant Munehisa Homma in the 1700s to track commodity prices, although it is now used to analyse other types of assets.
Heikin means “average” or “balance” in Japanese, and Ashi means “bar” or “foot.” The technique modifies a standard candlestick chart to use two-period averages in calculating each candle. This smooths out the data to filter out noise, which is expected to help traders identify market trends and reversals, although it also hides gaps and some of the price information.
Traders may use Heikin Ashi chart analysis to support them when deciding whether to open a trade or exit ahead of a reversal. They can adjust their positions based on this information by placing take-profit and stop-loss orders.
How Are Heikin Ashi Candles Calculated?
Heikin Ashi formula for each new candle:
1.Close
HA Close=(Open+High+Low+Close) / 4
→ The average of the current period’s open, high, low, and close.
2. Open
HA Open=(HA Open previous+HA Close previous) / 2
→ The midpoint of the previous candle’s open and close values.
This formula helps to smooth transitions between candles.
3. High
HA High=max(High, HA Open, HA Close)
→ The highest value among the current period’s high, open, and close.
4. Low
HA Low=min(Low, HA Open, HA Close)
→ The lowest value among the current period’s low, open, and close.
Let’s assume the current period has these OHLC prices:
- Open: 100
- High: 110
- Low: 95
- Close: 105
And the previous Heikin Ashi candle had:
- HA Open previous: 98
- HA Close previous: 102
Then:
- HA Close = (100 + 110 + 95 + 105) / 4 = 102.5
- HA Open = (98 + 102) / 2 = 100
- HA High = max(110, 102.5, 100) = 110
- HA Low = min(95, 102.5, 100) = 95
So, the new Heikin Ashi candle would be plotted as:
Open = 100, High = 110, Low = 95, Close = 102.5
Trading platforms such as TickTrader have charts that use the Heikin Ashi calculation and can be set to display different timeframes, such as intraday, weekly, monthly, and so on.
Heikin Ashi and Japanese Candlesticks: Differences
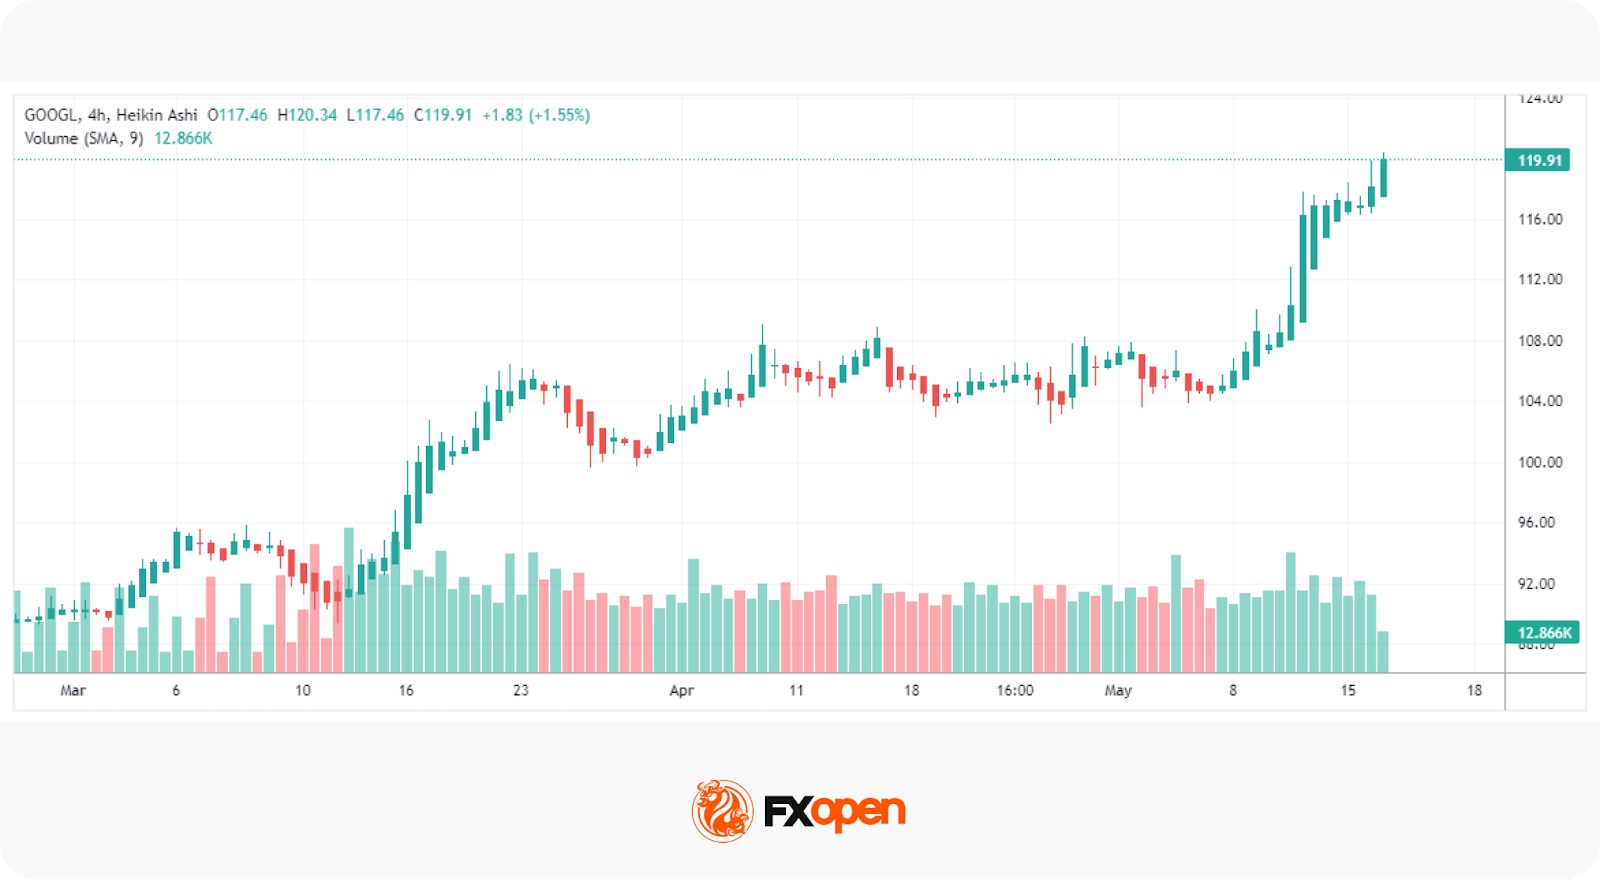
The Heikin Ashi chart looks like regular candlesticks, but the latter comprises the open, high, low and close (OHLC) values. Instead, Heiken Ashi candlesticks are calculated with the modified close, open, high and low (COHL) formula. As a result, they appear smoother because price movements are averaged out.
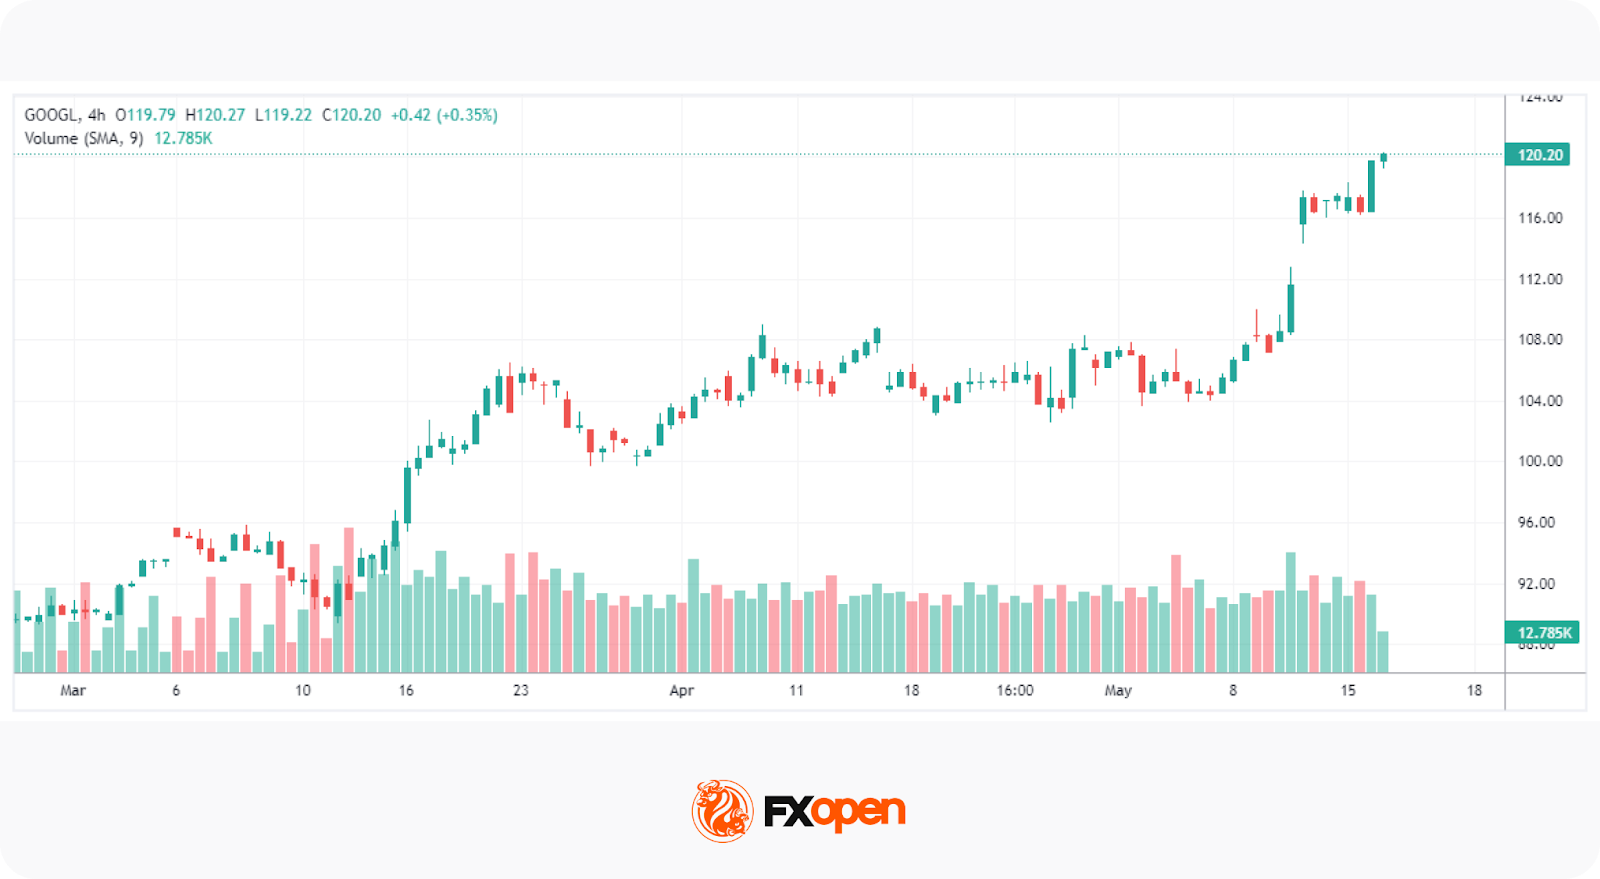
Japanese Candlestick
Heikin Ashi
HA candles tend to remain bearish when an asset’s value is in a downward trend and remain bullish during an upward trend, unlike standard candlesticks that sometimes alternate directions even when the movement is predominantly going the same way.
Because HA candlesticks use averages, they do not necessarily match the price at which the market is trading, whereas standard candles do match the current asset price.
You can analyse HA charts alongside Japanese candlestick charts to confirm market trends.
How Do Traders Trade with Heikin Ashi Candles?
Traders use Heikin Ashi bars to determine when to stay in trades and when to exit as the trend pauses or reverses course. Like with standard candlesticks, when the price rises, the candles are bullish (usually green or white), while when the price declines, the candles are bearish (usually red or black).
Traders can find standard patterns, including head and shoulders and inverted head and shoulders, wedges, pennants, and triangles, on the HA chart too. However, it’s worth remembering that although Heikin Ashi candle patterns are typically considered to be reliable, they can give false signals like all technical indicators.
How do you read HA candlesticks, and how might you use them to direct your trading strategies?
Trend Strength
A HA chart smooths out directional movements with more consecutive bars of the same colour, eliminating brief corrections or consolidations to provide a clearer view of the strength of the trend. The most common way to use the chart is to identify the start of a strong trend.
Hollow or green candles indicate a bullish trend, and a series of green candlesticks with no lower shadows provides a strong signal, so in this situation, you might choose to open or add to a long position.
As filled or red candles point to a downtrend, and a series of red candlesticks with no upper wicks provide a strong signal, you might opt to go short when you observe these indications.
When a trend is strong, traders may stay in the trade and use a trailing stop loss.
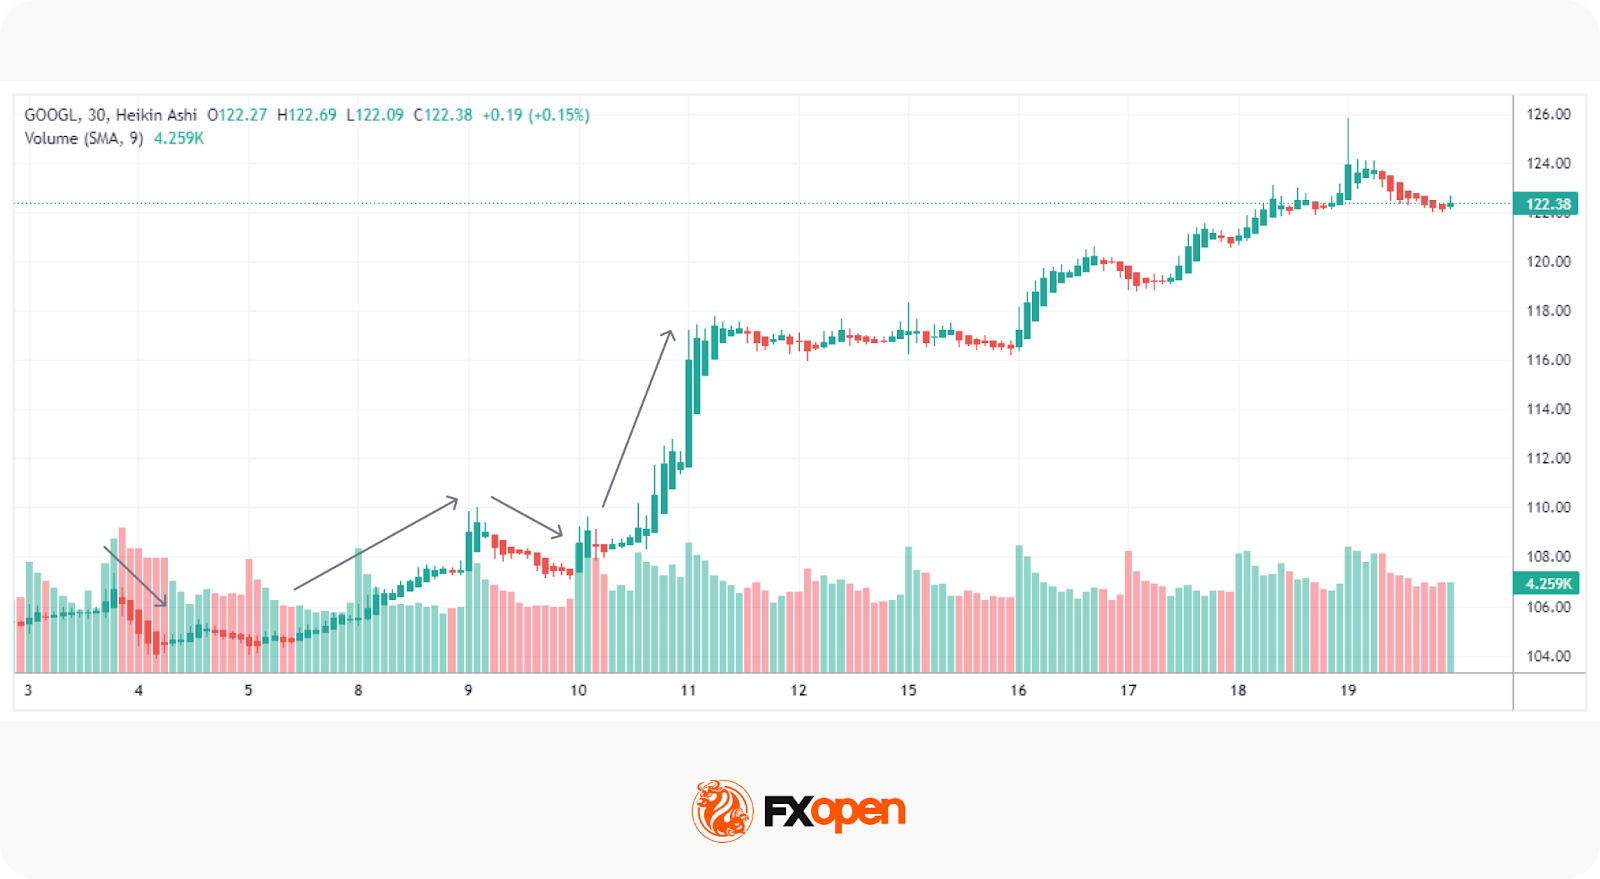
Trend Reversal
A change in the colour of the candlesticks and a shift to candles with small bodies and long upper and lower wicks – known as Doji candlesticks – indicate a potential change in the direction of the market. This may support your decision when to exit a trend-following trade or enter a new position.
If the candles indicate a reversal of a bearish trend, you might choose to go long, or if the candles point to the reversal of a bullish course, you might choose to go short. You could also decide to wait for confirmation of a reversal before making a move, as the market could be pausing rather than reversing.
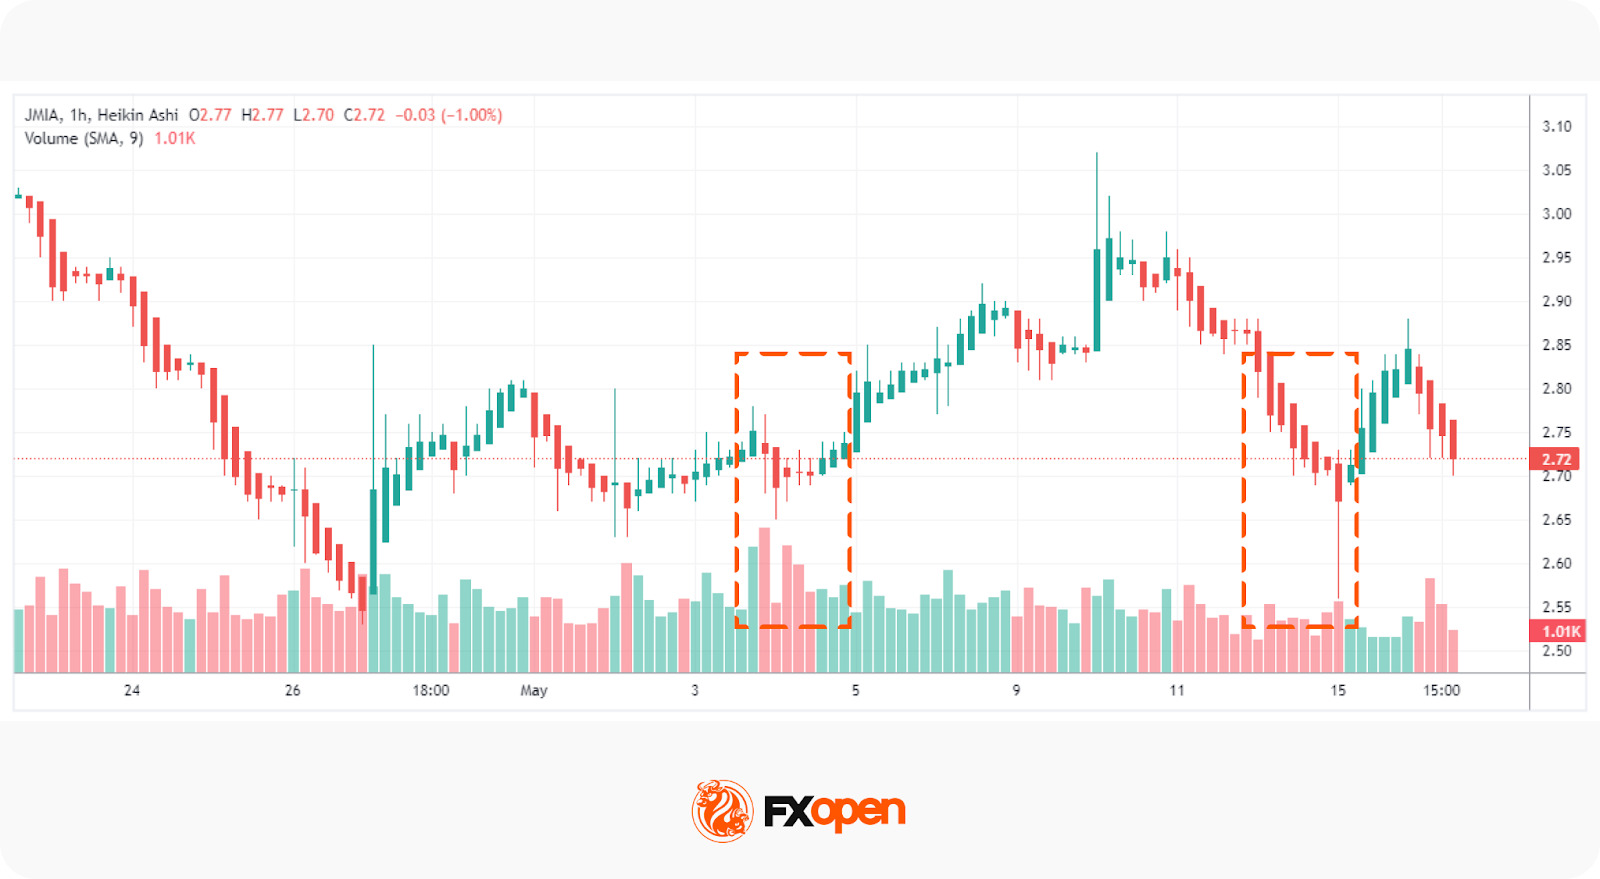
The chart above shows how the bottom wicks on long red candles get longer as the price continues to fall, indicating that it was being pushed back up as buying pressure began to increase, eventually resulting in a strong upward move.
Advantages and Limitations
Heikin Ashi charts are a popular variation of traditional candlestick charts used by traders to identify market trends and filter out noise. However, they have both advantages and limitations that should be considered.
Advantages
1. Clearer Trends
This chart type smoothes price data by averaging values, making trends more straightforward.
- Bullish trends: typically display a series of green candles with little or no lower shadows.
- Bearish trends: show a series of red candles with little or no upper shadows.
2. Noise Reduction
Because Heikin Ashi candles are calculated using averages (not raw price data), they filter out minor price fluctuations. This smoothing effect may help traders stay in trades longer by reducing false signals caused by short-term volatility.
3. Trend Reversal Detection
Reversal signals in such charts could be more solid. For example:
- A transition from a series of red candles to green indicates potential trend reversal.
- Candles with small bodies and long wicks often signal market indecision or trend exhaustion.
4. Widely Used for Automated and Visual Analysis
This chart type is widely used in algorithmic trading systems and trading bots to smooth price inputs for momentum-based strategies. Manual traders prefer these charts when they rely on pattern recognition.
Limitations
1. Lack of Real-Time Price Accuracy
Heikin Ashi candles do not represent actual market prices.
- The open, high, low, and close values are averaged.
- The current candle may not match the real-time market price, which can mislead traders relying on exact levels for entries, exits, or stop losses.
2. Delayed Signals
Because this chart type uses averaged data, trend reversals often appear later than on standard candlestick charts. This lag can result in missed entries or exits, especially in fast-moving markets.
3. Less Frequent in Intraday or Scalping Strategies
Scalpers require precise price information, thus, a Heikin Ashi chart may be less popular among them. While swing traders and those who rely on medium-term trend analysis, may use such candles more often.
4. Limited Use in Support/Resistance Analysis
Heikin Ashi charts distort the actual price levels, which makes it difficult to plot accurate support, resistance, or Fibonacci retracement zones.
Summary Table
Final Thoughts
Heikin Ashi charts offer traders a clearer perspective on market trends by filtering out short-term volatility and highlighting the underlying direction of price movement. While they are not predictive tools, their smoothing effect makes them a popular tool for identifying trend continuations and potential reversals.
By combining Heikin Ashi analysis with traditional candlesticks or technical indicators, traders can build a trading strategy. As with any method, the usage of chart type is accompanied by consistent analysis, disciplined risk management, and a clear understanding of market context.
If you want to trade on Heikin Ashi charts of more than 700 assets and gain access to tight spreads from 0.0 pips and low commissions from $1.50, you can consider opening an FXOpen account.
FAQ
How May Traders Use Heikin Ashi Charts?
Traders use Heikin Ashi charts to identify market trends and filter out short-term volatility. These charts may help confirm trend direction and signal potential reversals when used alongside technical indicators such as Stochastic Oscillator or Parabolic SAR.
How Can Traders Read a Heikin Ashi Chart?
Heikin Ashi chart type shows trend strength through candle colour and size. Consecutive bullish candles with no lower shadows indicate a strong uptrend, while bearish candles without upper shadows suggest a strong downtrend. Small or doji-like candles may signal consolidation or a possible reversal.
How Do Heikin Ashi Candles Work?
Heikin Ashi candles are calculated using averaged price data from the current and previous periods. This smoothing formula reduces noise and highlights the dominant market direction, allowing traders to visualise trends more clearly than on standard candlestick charts.
Do Professional Traders Use Heikin Ashi?
There are no statistics but many traders use Heikin Ashi charts as part of their technical analysis to confirm trends and manage positions. While they rarely rely on it alone, this chart type is a valuable complement to traditional charting methods.
This article represents the opinion of the Companies operating under the FXOpen brand only. It is not to be construed as an offer, solicitation, or recommendation with respect to products and services provided by the Companies operating under the FXOpen brand, nor is it to be considered financial advice.
Stay ahead of the market!
Subscribe now to our mailing list and receive the latest market news and insights delivered directly to your inbox.


Latest articles

Weekly Market Insights with Gary Thomson: US Inflation, UK GDP, Chair Warsh Testimony, and Earnings
In this video, we’ll explore the key economic events and market trends, shaping the financial landscape. Get ready for insights into financial markets to help you navigate the week ahead. Let’s dive in!
In this episode of Market

GBP/AUD Analysis: The Tug-of-War Begins
Oil is back in the driver's seat, and both the pound and the aussie are feeling its grip. The Bank of England held rates at 3.75% in June, but with UK inflation at 2.8% and crude oil climbing

Australian Dollar Holds Above the Current Market Profile
The minutes from the Reserve Bank of Australia's (RBA) June meeting, released on 30 June, suggested that policymakers are not yet ready to rule out further policy tightening. Board members noted persistent excess demand and broad-based inflationary pressures across the