


How to Use Rectangle Chart Patterns in Trading
FXOpen

In the dynamic realm of trading, understanding patterns is essential for trading effectively. Among the myriad of patterns, the rectangle stands out for its clarity and commonality. For traders who aim to leverage such patterns to their advantage, platforms like TickTrader, offered by FXOpen, become indispensable. Not only does FXOpen provide an array of tools to aid in analysing these patterns, but for those ready to dive deep into the trading world, the option to open an FXOpen account ensures they're equipped with all the necessary resources from the outset.
What Is a Rectangle Pattern?
A rectangle is a pattern that appears during a trend pause, signifying a sideways price movement between parallel support and resistance zones. Prices typically consolidate within this pattern before resuming the previous trend or occasionally reversing it. In most cases, the rectangle signals a trend continuation.
This formation represents a phase of consolidation or indecision, with buyers and sellers vying for dominance but neither prevailing. Once a confirmation candle closes above or below the rectangle's upper or lower boundary, the pattern is deemed complete, indicating the trend's likely direction. The rectangle pattern can appear during both uptrends and downtrends.
Is the rectangle chart pattern bullish or bearish? It can manifest as bullish and bearish formations, each providing valuable insights into potential market movements.
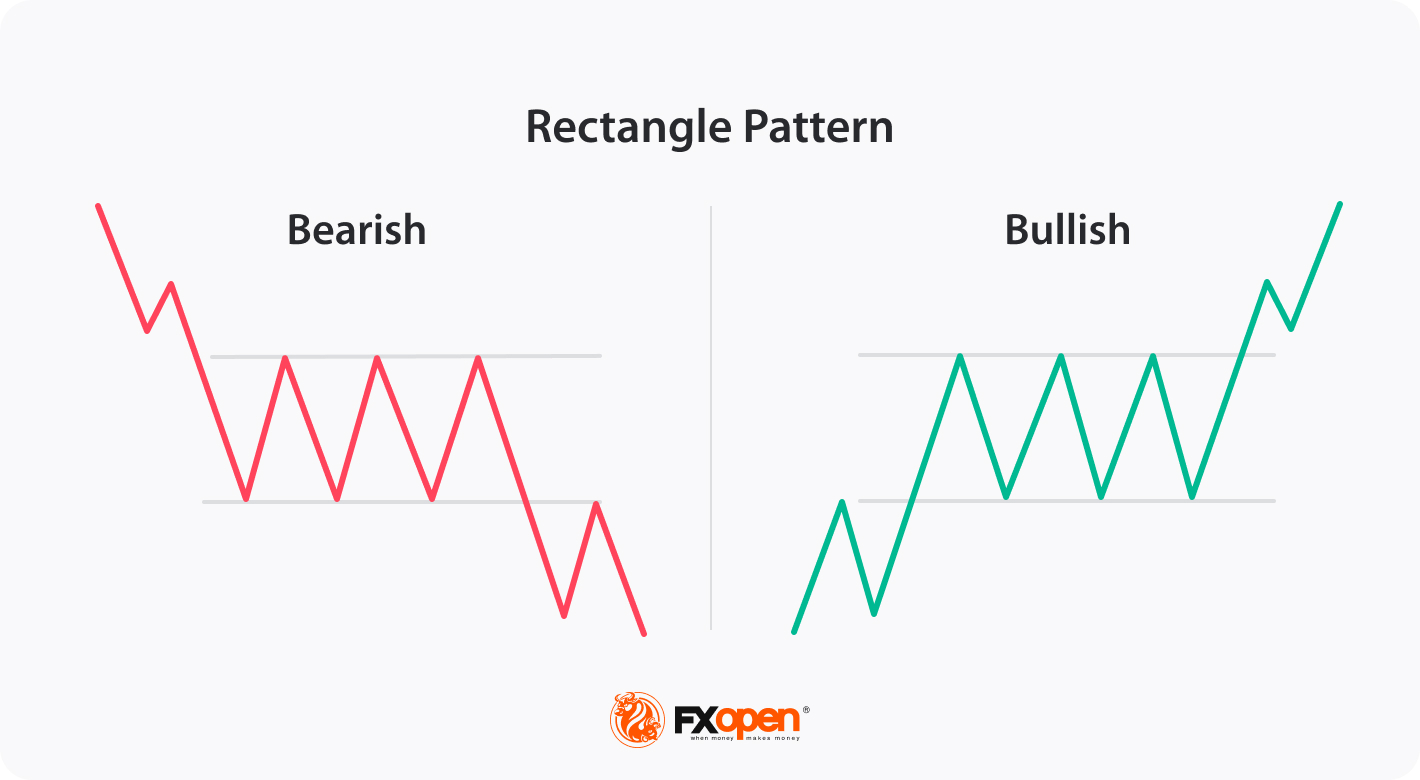
Bullish Rectangle
A bullish rectangle, or a rectangle top pattern, appears within an uptrend. Although the pattern can indicate trend reversal and continuation, it usually serves as a continuation formation. Thus, it predicts a continuation of the uptrend.
Bearish Rectangle
Emerging within a decline, a bearish rectangle, or rectangle bottom chart pattern, forms when the price consolidates because sellers look for reasons to pull it further down. Although it can appear before a downtrend reverses, it likely indicates sellers are taking a breather, pausing before continuing their downward push.
How to Identify a Pattern of Rectangles
Here are some key characteristics to help you identify rectangles on a price chart:
- Horizontal Price Range: The hallmark of a rectangle is its horizontal price movement within a confined band, denoting a price equilibrium.
- Parallel Support and Resistance: The rectangle's boundaries should be nearly parallel, creating horizontal support and resistance zones. These levels gain legitimacy with multiple touches on either side.
- Consistent Highs and Lows: Within the rectangle, price highs and lows maintain uniformity, signifying a tug-of-war between buyers and sellers.
- Decreasing Volume: As the formation matures, trading volume often recedes, suggesting that traders are on the sidelines awaiting a clearer market direction.
- Duration: A protracted consolidation phase enhances the potential vigour of the subsequent breakout.
- Breakout Strategy: Traders anticipate a pronounced move beyond the rectangle's upper boundary (signalling bullish intent) or its lower boundary (indicating bearish potential).
- Volume Confirmation on Breakout: An ideal breakout is accompanied by a volume spike, reinforcing the breakout's legitimacy. A volume-backed move usually has better sustainability.
- Price Objective: Post-breakout, traders often project a price target equivalent to the rectangle's height, determined by the difference between its highest and lowest points.
- False Breakouts: Occasionally, prices might momentarily exceed the rectangle before returning to it. To mitigate false breakout risks, some traders seek additional candlesticks or technical indicators as confirmation.
Rectangle technical analysis delves into deciphering and executing trades based on the rectangle chart pattern in financial landscapes. Now, let's delve into trading strategies involving rectangles.
How to Trade the Rectangle Pattern
Trading the rectangle formation involves specific steps for entry, take profit, and stop loss determination. Here's how to approach each aspect:
Entry
- Breakout Confirmation: Before committing to a position, traders look for a decisive breakout from the rectangle formation. A confirmed breakout occurs when the price closes distinctly above (bullish) or below (bearish) boundaries of the rectangle.
- Avoiding False Breakouts: By waiting for a clear candlestick close outside the rectangle, traders reduce the risk of entering a false breakout. Committing to the breakout direction increases the likelihood of trading with the new emerging trend.
Take Profit
- Measuring the Rectangle: One prevalent technique to set a take-profit level involves measuring the rectangle's height. The height, calculated from the upper boundary to the lower, gives traders an idea of the potential price target.
- Profit Target Setting: Traders add the rectangle's height to the breakout point for a bullish breakout. For a bearish breakout, subtract the height from the breakout point. This computed price is where traders often aim to take their profits, anticipating the price's movement in the breakout direction.
Stop Loss
- Bullish Trades: If a trader decides to go long after an upward breakout, the stop-loss is usually set just beneath the rectangle's upper boundary. This placement ensures minimal loss if the breakout proves false or the trend reverses.
- Bearish Trades: Conversely, after entering a short trade post a downward breakout, the stop-loss is typically positioned just above the rectangle's lower boundary.
Live Market Example
To better understand rectangles and their implications in real-time trading, let us examine a live market example by looking at a case involving the EUR/USD pair.
A bearish rectangle chart pattern is building inside an existing downtrend, as shown below; the blue trend line indicates a sequence of lower lows and lower highs. As EUR/USD prices began to traverse sideways, a distinct rectangle took shape. This sideways movement delineated a support and resistance zone, depicted by the red rectangle, confined within a specific range.
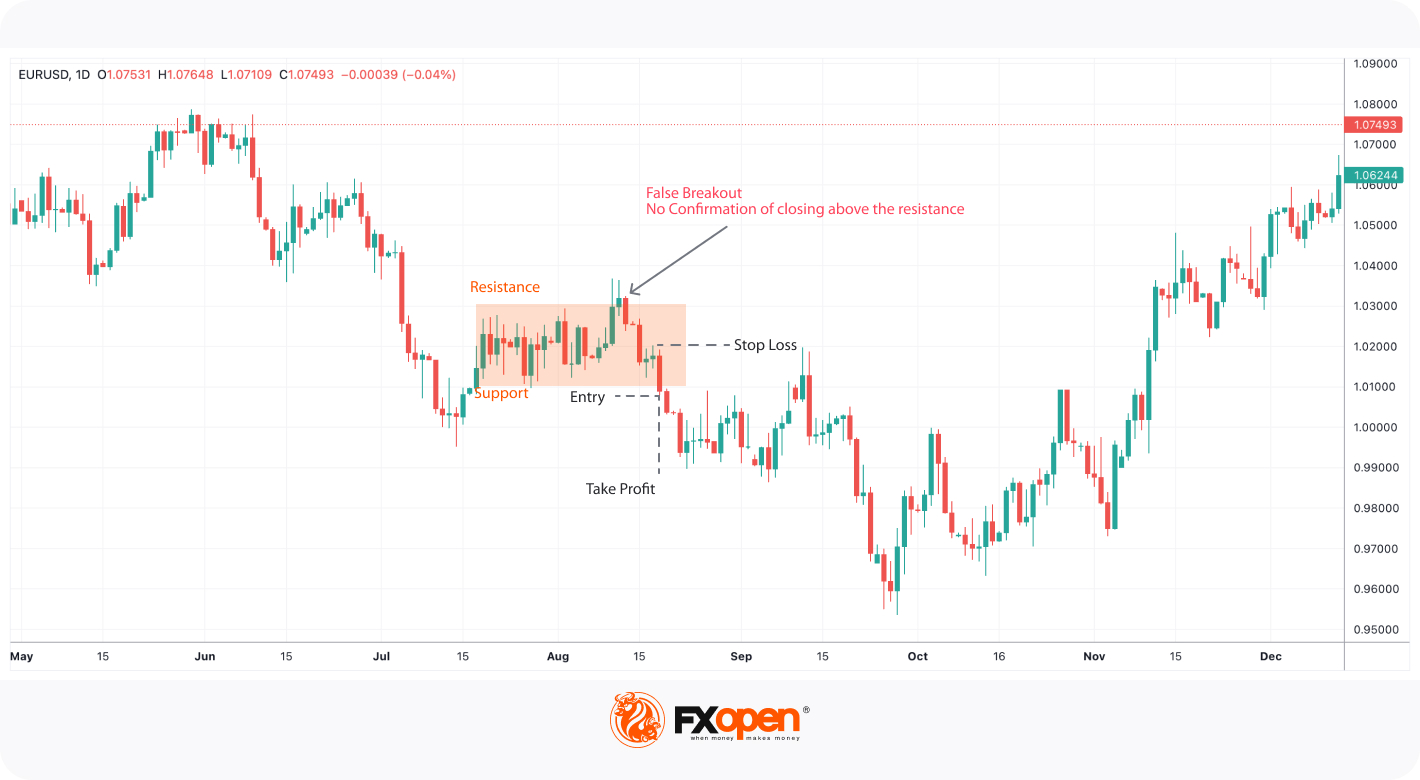
Traders eyeing a bullish rectangle would seek a candlestick closure above the resistance level. However, there was only a false breakout.
When a candlestick finalised its position outside of this rectangle, leaning towards a bearish direction, it signalled an entry point for traders. The designated stop level is based on the swing height of this pivotal candlestick, while the profit price is deduced by projecting the full height of the rectangle downwards.
You can use the TickTrader platform to spot a rectangle stock chart pattern or a rectangle commodity chart pattern.
Conclusion
Within the financial trading landscape, the rectangle emerges as an indispensable instrument, highlighting periods of consolidation and forthcoming breakouts. For traders, a deep understanding of its intrinsic characteristics and principles is crucial. This knowledge not only enriches their analytical toolkit but also empowers them to capitalise on trend continuations or shifts in different markets. Traders can determine rectangle patterns in stocks, commodities, cryptocurrencies*, and currency pairs.
*At FXOpen UK and FXOpen AU, Cryptocurrency CFDs are only available for trading by those clients categorised as Professional clients under FCA Rules and Professional clients under ASIC Rules, respectively. They are not available for trading by Retail clients.
This article represents the opinion of the Companies operating under the FXOpen brand only. It is not to be construed as an offer, solicitation, or recommendation with respect to products and services provided by the Companies operating under the FXOpen brand, nor is it to be considered financial advice.
Stay ahead of the market!
Subscribe now to our mailing list and receive the latest market news and insights delivered directly to your inbox.


Latest articles

Nasdaq 100: Is This the Correction Traders Have Been Waiting For?
The Nasdaq 100 (US Tech 100 Mini on FXOpen) remains caught between two opposing forces: cooling inflation on one side, and persistent geopolitical instability on the other. On 14 July, June's CPI print came in softer than expected, easing near-term

XRP/USD: Symmetrical Triangle Forms as Trading Volume Fades
On 6 July, Ripple received a full Crypto-Asset Service Provider (CASP) licence under the Markets in Crypto-Assets (MiCA) regulation from Luxembourg's financial regulator, the CSSF. The approval allows the company to offer regulated crypto payment services across all 30 countries

AI Valuations Are Back in the Spotlight
Artificial intelligence remains the dominant investment theme of 2026, but investors are increasingly questioning whether AI stock valuations are keeping pace with reality.
💰 Big Tech continues to invest at an unprecedented scale, with hyperscaler AI spending projected to exceed $800