


How to Use the Belt Hold Pattern in Trading
FXOpen
A Belt Hold candle is a pattern that captivates traders in financial markets due to its unique features and strategic placement on price charts. Its distinctive appearance makes it a subject of keen observation and analysis. In this FXOpen article, we will delve into this formation, its significance, and how traders can interpret and incorporate it into their trading strategies.
What Is a Belt Hold Pattern?
A Belt Hold, sometimes called Belt Hold line, is a candlestick formation that is commonly used to identify potential trend reversals in financial markets. It consists of a single candlestick that can be either bullish or bearish, depending on the previous trend.
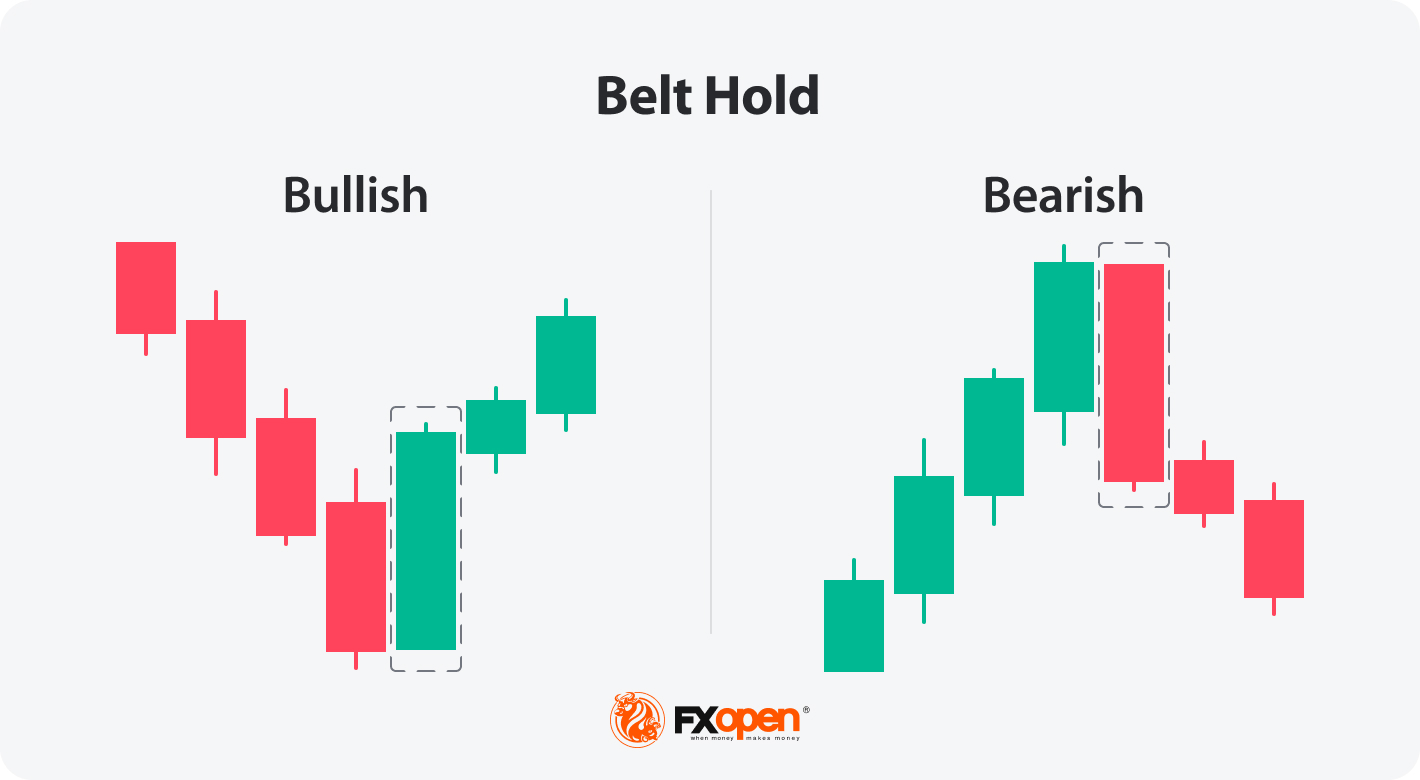
A bullish setup occurs when the candle’s opening price is the same as its low, but the closing price is significantly higher, forming a long bullish body. This pattern implies that market control has shifted to the buyers. It is often considered a bullish reversal signal, reflecting a potential change in the prevailing downtrend.
Conversely, a bearish formation is identified by a candle with an opening price that is the same as its high while the closing price is considerably lower, resulting in a long bearish candlestick. This formation indicates that sellers dominated the market, leading to a potential reversal of an existing uptrend.
How to Spot a Belt Hold Pattern in the Chart
Identifying a bullish Belt Hold candlestick pattern involves observing the downtrend for a single candle with specific characteristics:
- The opening price is equal to the candle’s low.
- The closing price is significantly higher and near the candle’s high.
For the bearish Belt Hold candlestick pattern, the characteristics are as follows:
- The opening price is equal to the candle’s high.
- The closing price is considerably lower and near the candle’s low.
How to Trade the Belt Hold Formation
When using the Belt Hold pattern, traders may implement the following strategies:
- Bullish Setup: Traders may open a long position as soon as the bullish candle is formed after the downtrend. Some may wait for additional confirmation, such as one-two candlesticks closing above the pattern and increased bullish volumes.
- Bearish Setup: Traders consider opening a short position when the bearish candle is formed after an uptrend. Like with the bullish formation, additional confirmation for increased confidence may be required in the trade, with one or two candles closing below the pattern and rising bearish volumes.
For exiting the position, traders may choose to apply the following approach:
- Bullish Setup: Consider taking profits when the price reaches a resistance level or shows signs of slowing down. A stop-loss level may be placed in accordance with the risk-reward ratio below the pattern.
- Bearish Setup: Consider taking profits when the price approaches a support level or shows signs of a potential bounce. A stop-loss level may be placed in accordance with the risk-reward ratio above the pattern.
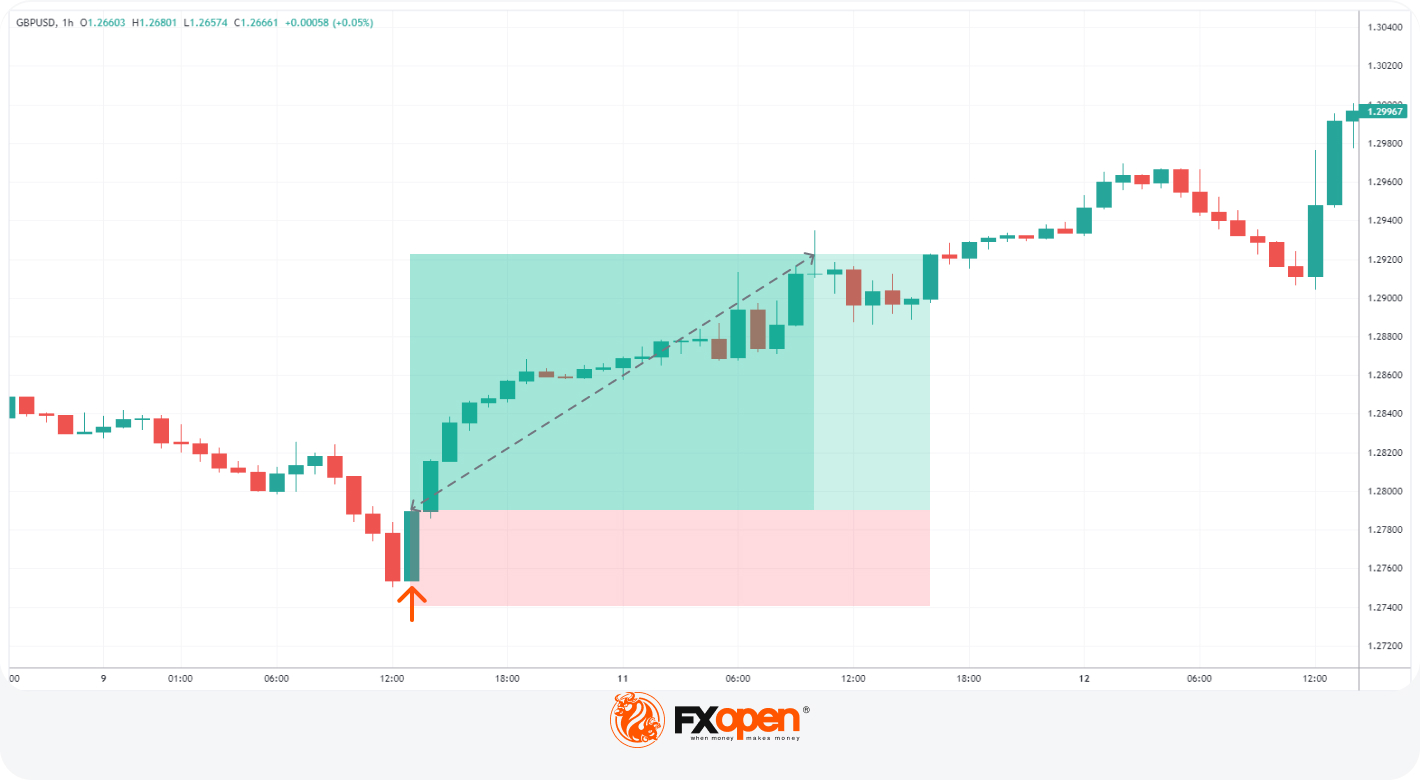
A bullish setup is seen on the H1 chart of the GBPUSD pair. The trader goes long at the close of the candle with the take profit at the next resistance. Their stop loss lies below the setup.
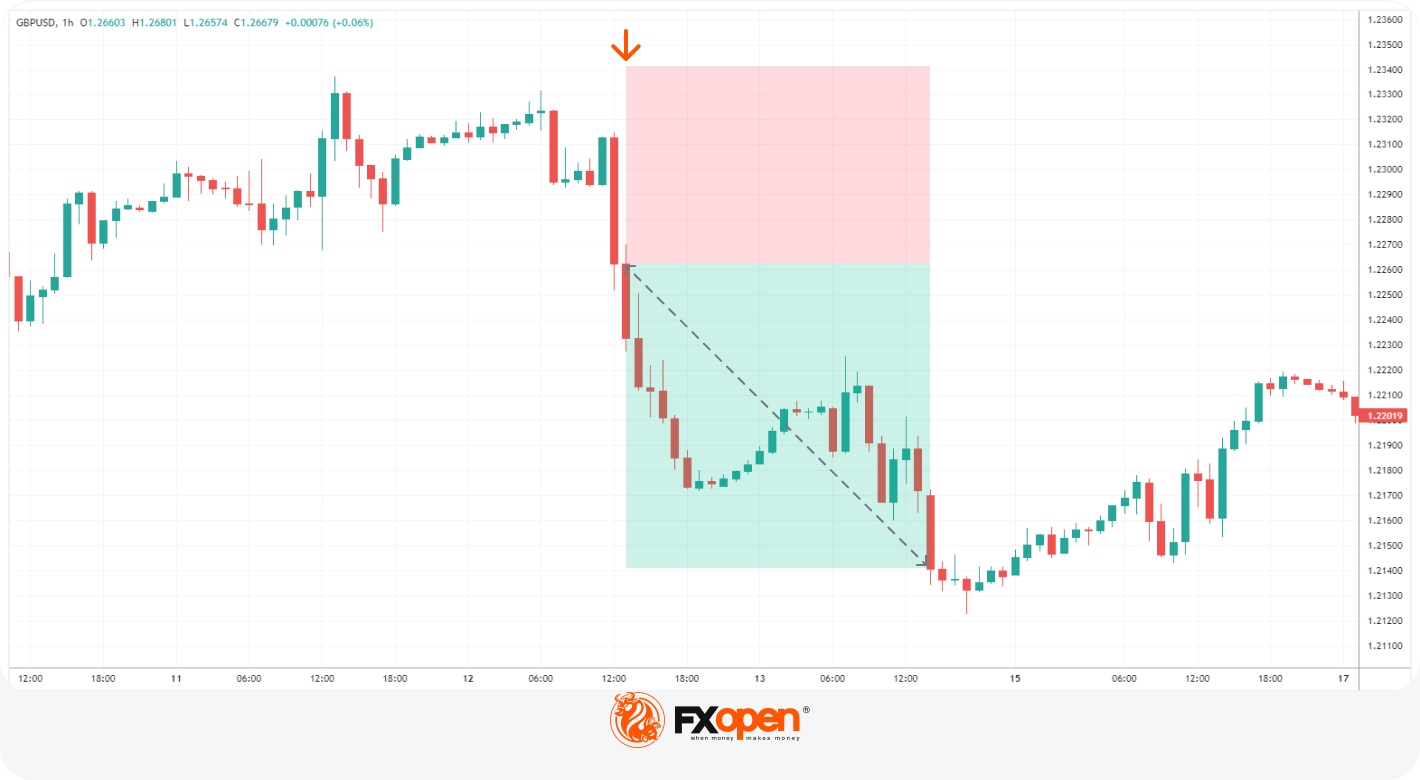
The chart above shows a bearish setup on the TickTrader chart. The trader takes an aggressive entry without waiting for additional confirmation for a risk-reward ratio of 1:1.5. Their take profit is at the next support with the stop loss above the setup.
Takeaway
The Belt Hold can be an effective tool in your trading arsenal. However, traders use it in conjunction with other technical analysis tools and indicators for more comprehensive decision-making. As with any trading strategy, risk management is crucial, and you should be cautious of false signals by waiting for confirmation before entering a trade based on this formation. Once you get comfortable with this new pattern, you may open an FXOpen account to trade in over 600 markets with tight spreads and low commissions.
FAQs
Is Additional Confirmation Necessary Before Entering a Trade Based on the Belt Hold?
While not mandatory, traders prefer additional confirmation, such as one or two candlesticks formed in the direction of the formation and increased volumes, to potentially enhance confidence in the trade.
How Can I Use the Belt Hold with Other Technical Analysis Tools?
You can integrate the Belt Hold with other technical analysis tools. Traders combine it with support and resistance levels, confirmatory candlestick patterns, moving averages, and oscillators to potentially increase the reliability of their trading decisions.
What Role Does Risk Management Play When Trading the Belt Hold?
Risk management is crucial. Traders use stop-loss orders and set take-profit targets to manage risk and limit losses caused by any false signals the setup may provide.
Can I Apply the Belt Hold to Different Timeframes?
Yes, this setup can be applied to various timeframes, but you should adapt your entry, exit, and stop-loss strategies according to your risk aversion and money management techniques.
This article represents the opinion of the Companies operating under the FXOpen brand only. It is not to be construed as an offer, solicitation, or recommendation with respect to products and services provided by the Companies operating under the FXOpen brand, nor is it to be considered financial advice.
Stay ahead of the market!
Subscribe now to our mailing list and receive the latest market news and insights delivered directly to your inbox.


Latest articles

GBP/USD and EUR/GBP Await Key Bank of England Decision
The pound strengthened following the outcome of the US Federal Reserve meeting, where the central bank, as expected, kept interest rates unchanged. However, the Fed did not provide the market with clear signals of an imminent shift towards rate cuts,

Microsoft Analysis: Earnings Beat Expectations
On 29 July 2026, Microsoft reported its results for the fourth quarter of fiscal year 2026. Revenue reached $90 billion, up 18% year-on-year, while adjusted earnings per share came in at $4.74, comfortably ahead of analysts' expectations of $4.

EUR/USD: All Eyes on the Fed as the Range Reaches Its Breaking Point
The dollar's next move hinges on tonight's Fed decision, and this time markets genuinely don't know what to expect. While economists still lean toward a hold—with CME FedWatch odds sitting near 68.5% for no change—Kevin Warsh's hawkish