


The Three Black Crows Pattern: Trading Principles
FXOpen

Various candlestick and chart patterns indicate potential market reversals. One such formation is the three black crows pattern that indicates a potential bearish reversal in the price of an asset. You can find three black crows stock, commodity, and forex patterns. This FXOpen article will help you understand how such a pattern is formed, explaining how it can be used to spot trading opportunities in the market and demonstrating live trading examples.

What Are the Three Black Crows?
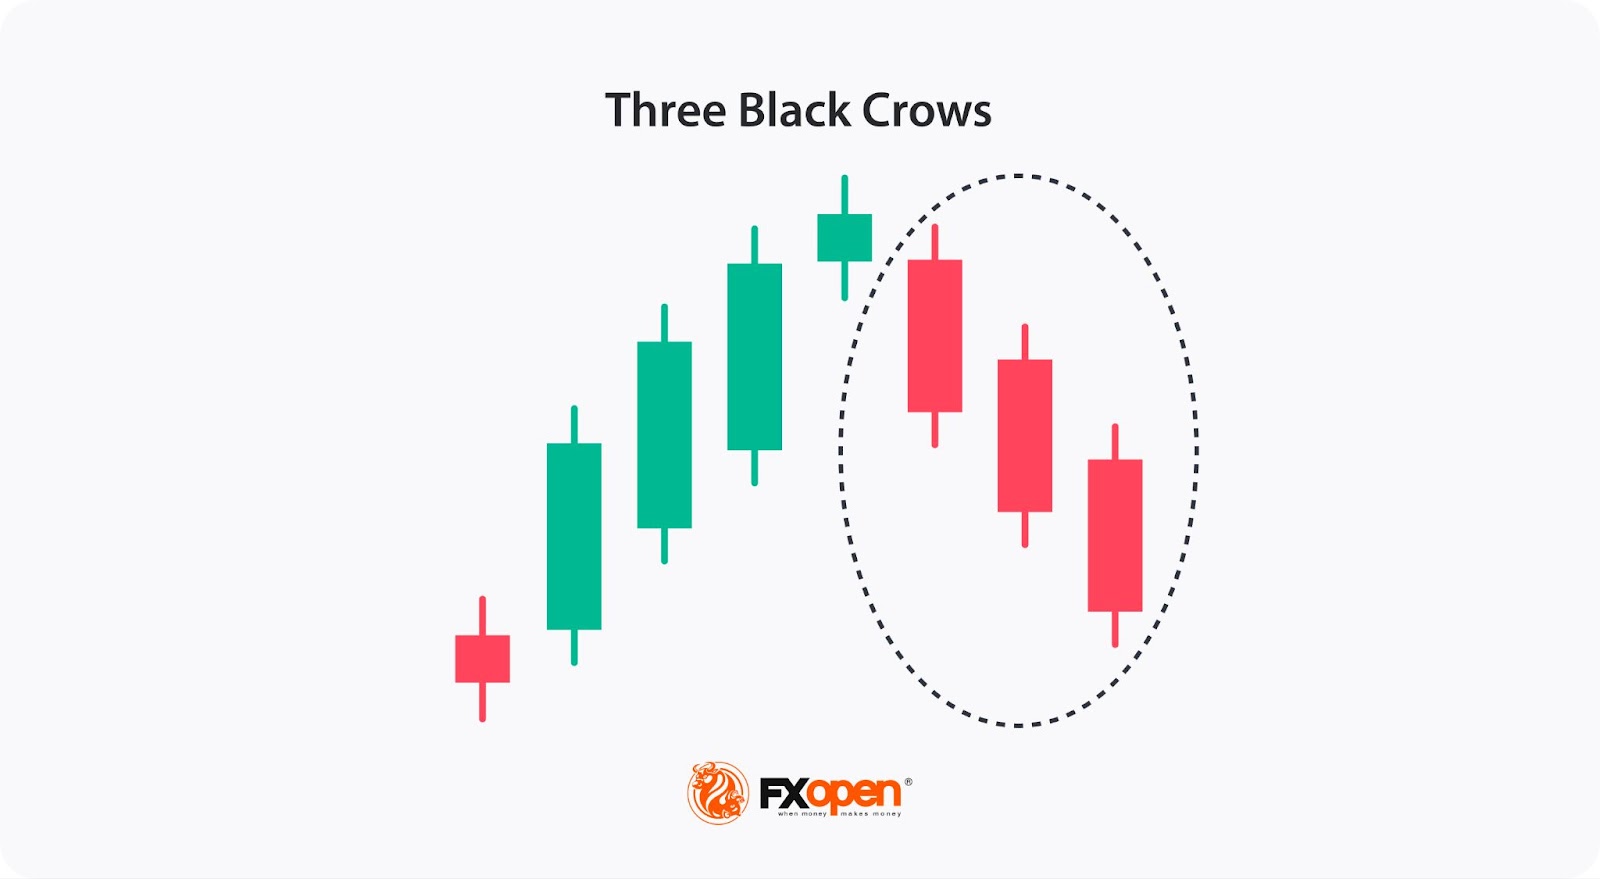
The three black crows is a bearish candlestick pattern used in technical analysis to signal a potential reversal of an uptrend. It consists of three consecutive long bearish candlesticks that occur after a strong upward trend. The pattern suggests that the momentum has shifted from buyers to sellers, indicating that a downtrend could be about to begin.
Key Characteristics:
- Three Consecutive Bearish Candles: The pattern is composed of three long bearish candlesticks that open within the body of the previous candle and close near their lows.
- Appears After an Uptrend: The pattern typically forms after a prolonged uptrend, signalling a potential shift in market sentiment.
- Declining Price with Minimal Wicks: The candles should ideally have small upper and lower wicks, showing that the sellers controlled the market throughout the session.
- Steady Decline: Each candlestick in the pattern opens higher than the previous candle’s close but then reverses to close lower.
Psychological Interpretation
The pattern reflects a growing bearish sentiment among traders. Each successive bearish candlestick suggests that sellers are taking over, and buying pressure is weakening. This gradual increase in selling activity is often interpreted as a sign that the market could be heading for a downturn.
How Can You Trade the Three Black Crows Chart Pattern?
The three black crows formation has general trading rules. They can be modified depending on the timeframe, market volatility, and risk tolerance.
- Entry
Once the formation is confirmed with the third long red candle and additional indicators, traders enter a short position below its low.
- Take Profit
The pattern doesn’t provide specific take-profit targets. Usually, traders use other technical indicators and strong support levels to determine a suitable take-profit point. Some traders set the take-profit order with regard to the risk-reward ratio, say 1:2 or 1:3.
- Stop Loss
The theory states that a stop-loss order can be placed above the first candlestick’s high to potentially limit losses. Moreover, it should be based on the trader's risk tolerance and trading approach.
Use the TickTrader trading platform to build your own trading strategy in the live market.
Live Market Example
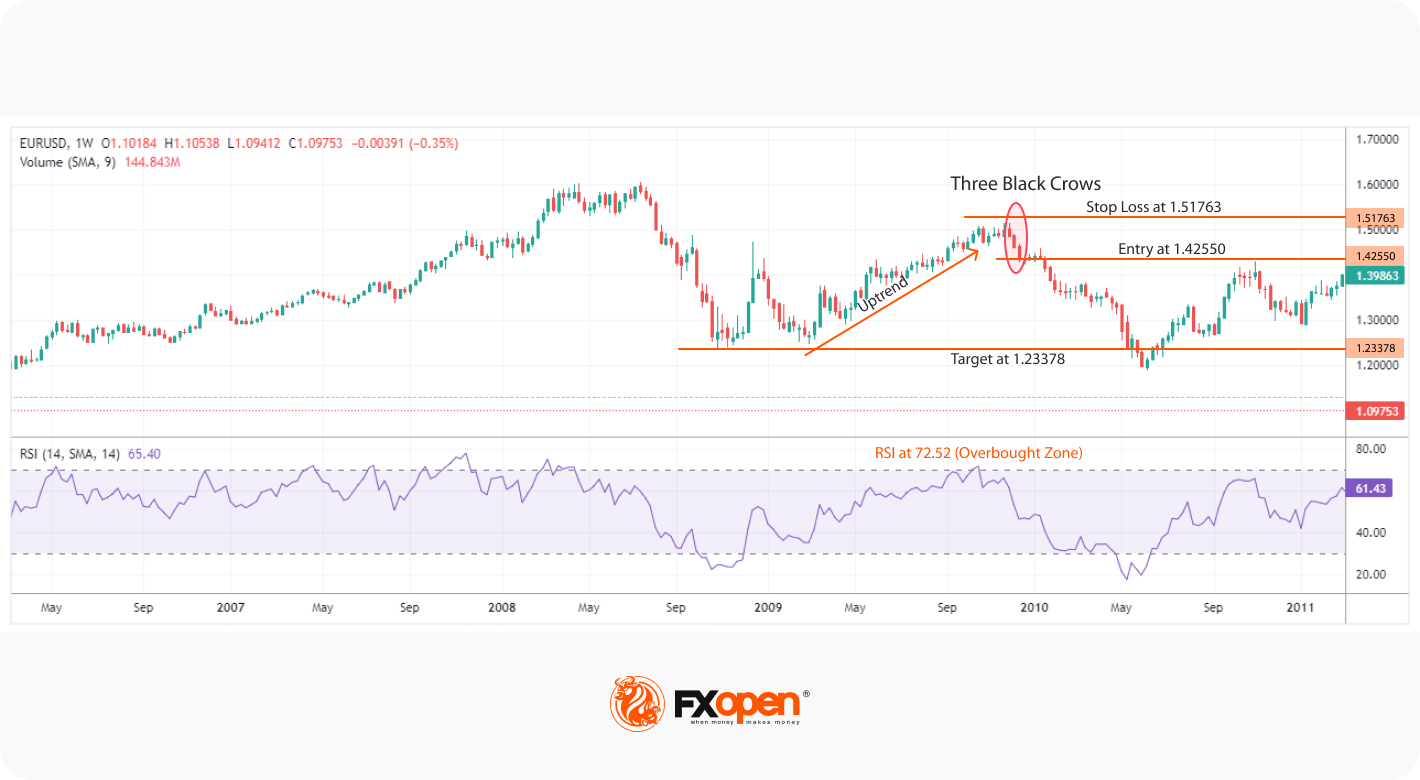
The above example shows the formation of the three black crows’ pattern on a weekly chart of the EUR/USD pair. When the pattern formed, the relative strength index had just left the overbought zone, confirming a potential trend reversal. A trader could go short after the third long bearish candle at 1.42550 and place a stop loss near above the first pattern’s candle (at 1.51763). The profit target could be set at the next important support level of 1.23378. It took six months for the price to reach the target level.
Practical Trading Strategies Using the Three Black Crows Pattern
Now, let’s look at two specific 3 black crows trading strategies.
MACD Strategy
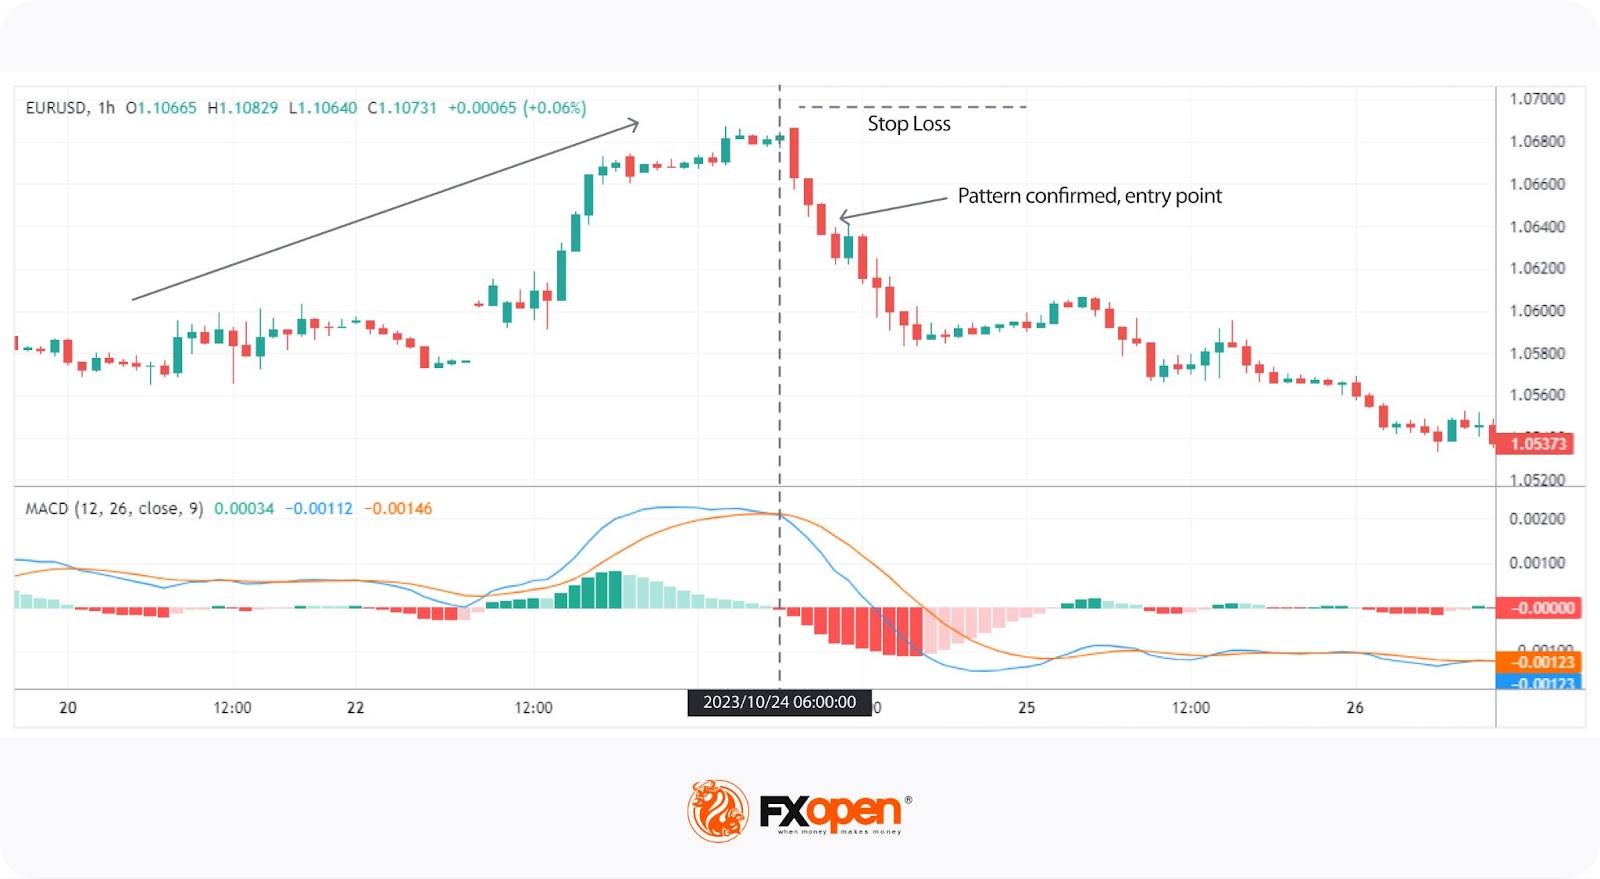
The combination of the three black crows candlestick pattern and the MACD crossover offers traders a strong signal of a bearish reversal after a bullish movement. The three black crows formation suggests weakening bullish momentum, while the MACD crossover confirms the shift in momentum from buyers to sellers. Together, these indicators increase the likelihood of a sustained downtrend, offering an opportunity for traders to enter the market with greater confidence.
Entry
- Traders observe a bearish MACD crossover within a few candles of the three black crows, either just before, during, or just after.
- Both conditions (pattern completion and MACD crossover) are typically met by the close of the third candle, signalling a potential opportunity for a sell trade.
Stop Loss
- Stop losses might be placed just beyond the swing point before the three black crows pattern to potentially protect against false signals.
Take Profit
- Traders often set take-profit targets at a risk-reward ratio, such as 1:2 or 1:3, to lock in potential returns.
- Alternatively, profits might be taken at key support levels where the price may reverse.
- Another option might be to exit the trade upon observing a bullish MACD crossover, signalling the end of the downtrend.
HMA Strategy
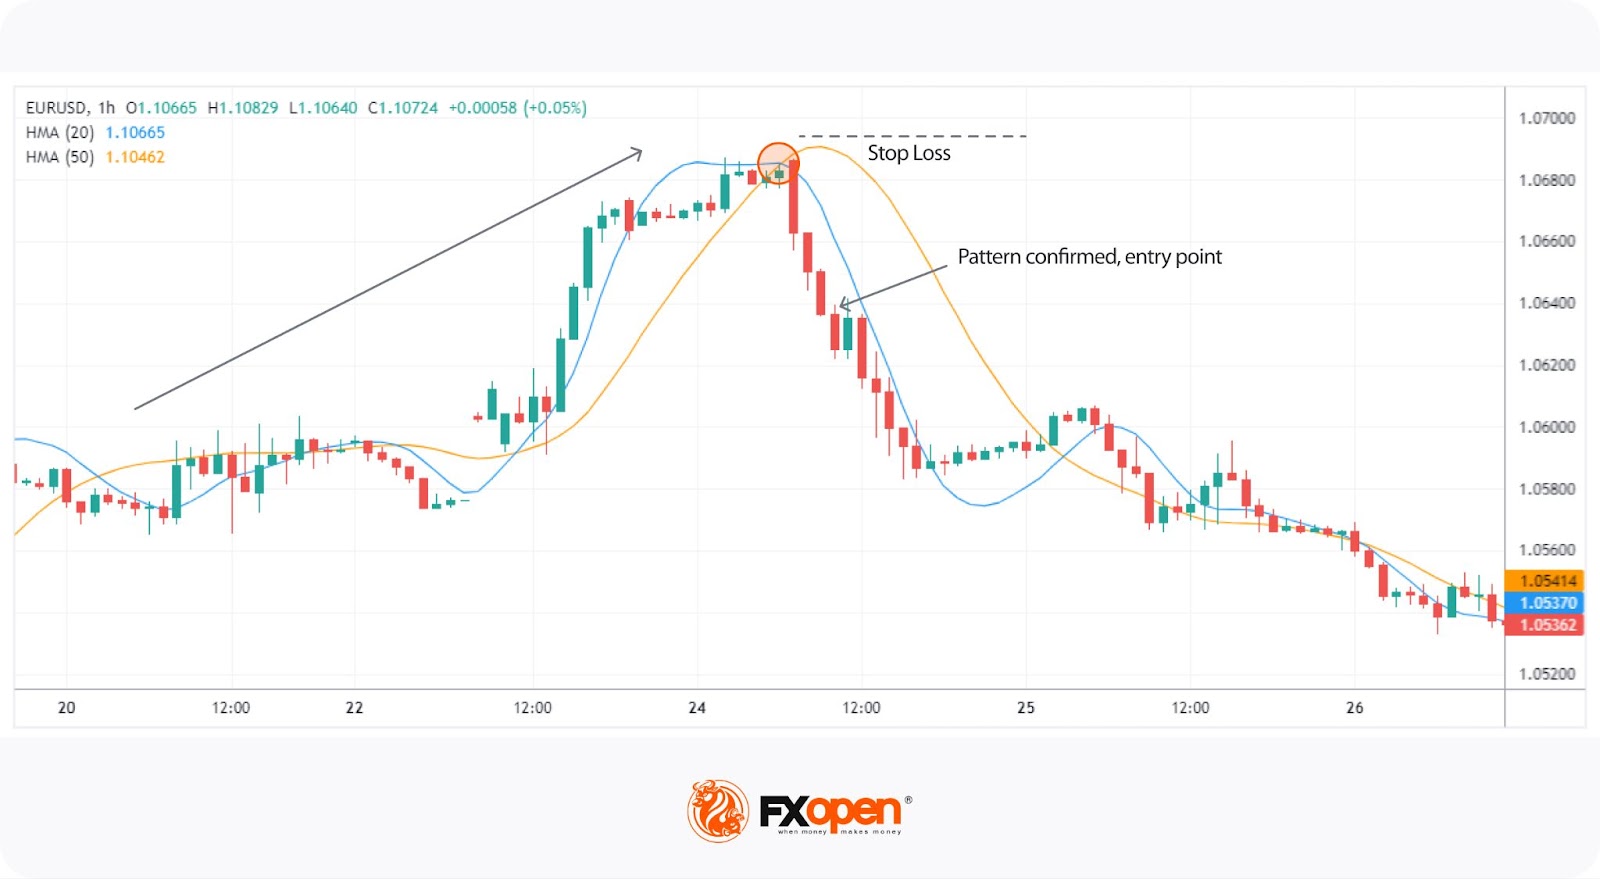
Using two hull moving averages (HMA), one set to 20 and the other to 50, provides traders with an extra filter to confirm that a downtrend is beginning following the three black crows pattern. The three black crows indicate a potential bearish reversal, but a cross of the 20-period HMA below the 50-period HMA helps confirm the strength of the downtrend. HMAs are used as they are more responsive to trend shifts than other moving averages.
Entry
- Traders look for a bearish crossover where the 20 HMA crosses below the 50 HMA within a few candles of the three black crows.
- Both the pattern and the HMA crossover typically confirm the start of a downtrend, allowing traders to enter a short position.
Stop Loss
- Stop losses might be set just above the swing high before the pattern.
- Alternatively, they might be placed above one of the HMAs, depending on the trader’s risk tolerance and desired level of protection.
Take Profit
- Take-profit targets might be based on a risk-reward ratio, such as 1:2 or 1:3.
- Traders may also take profits at a known support level where price reversal is likely.
- Another potential exit point is when the HMAs cross over again, signalling the end of the trend.
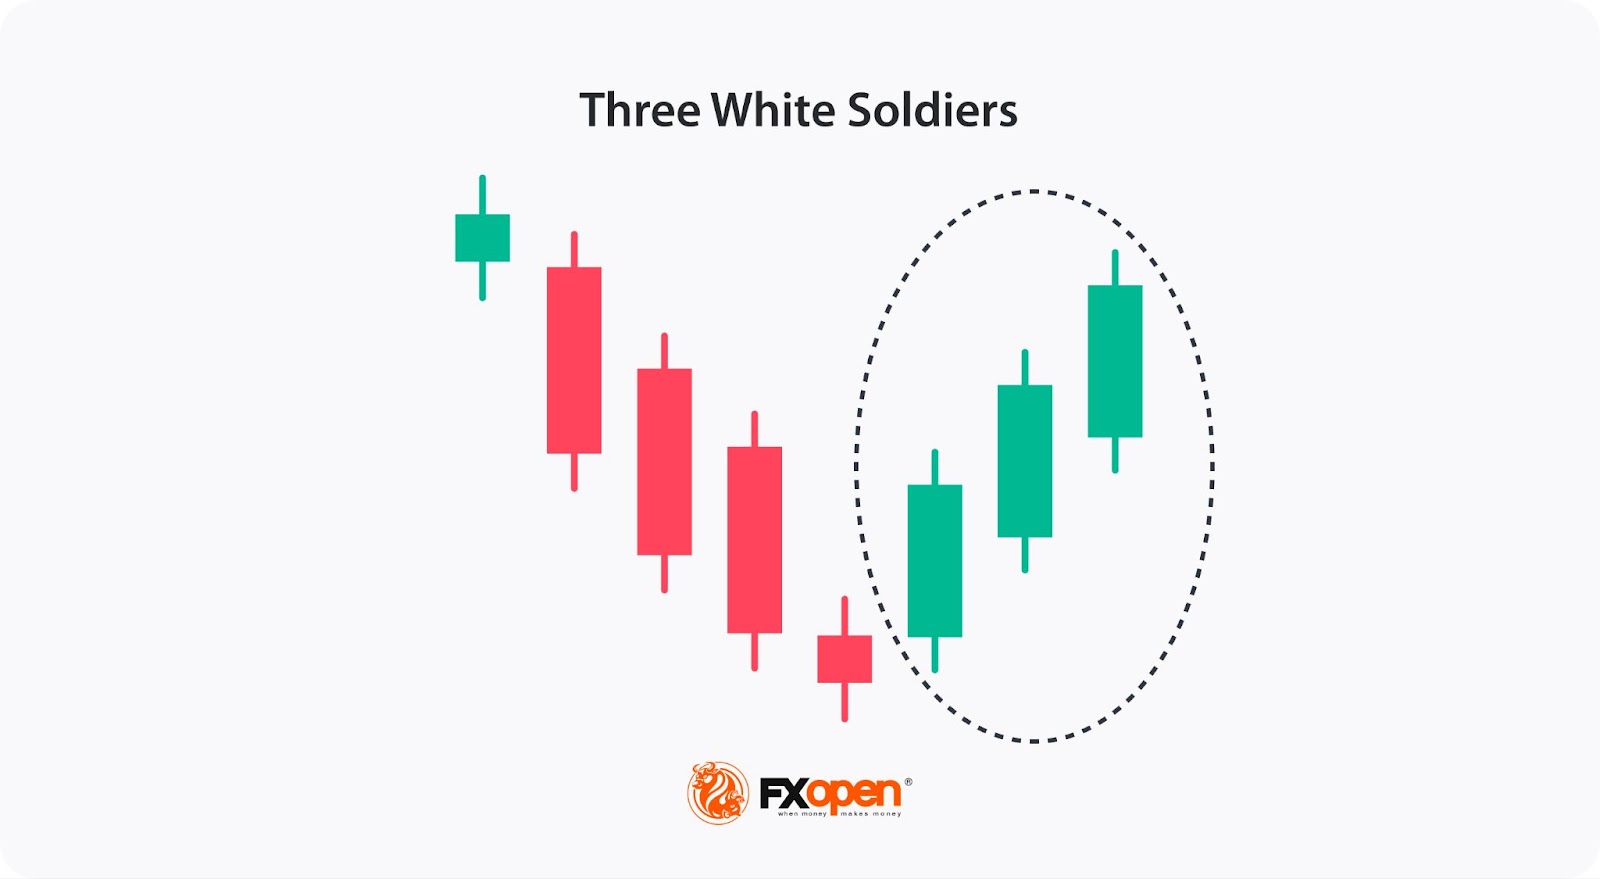
Three Black Crows vs Three White Soldiers
The three white soldiers candlestick pattern is the opposite of the three black crows. It is a bullish reversal setup that traders commonly use to identify the potential end of a prior downtrend and the start of an uptrend. It consists of three consecutive long bullish candlesticks with highs and lows higher than the previous ones and with little or no wicks. It suggests that the buyers have taken control of the market and that the price will likely continue rising. The candles together create a formation that resembles three soldiers marching in a bullish direction.
This formation is usually considered a strong bullish signal when it appears after a prolonged downtrend, in contrast to the three black crows formation, which indicates a strong potential bearish reversal. Traders often use it as an indication to enter long positions, with a stop-loss order placed near the bottom of the pattern.
Confirmation Tools
Confirmation tools can help traders ensure that the 3 black crows candlestick pattern signals a true bearish reversal rather than a short-term pullback. Here are some key tools to consider when confirming the pattern:
- Volume Increase: A spike in selling volume during the formation of the three black crows can confirm heightened pressure and a stronger likelihood of a trend reversal.
- Momentum Indicators: Tools like the Relative Strength Index (RSI), MACD, or a Stochastic Oscillator can show a shift in momentum. An overbought RSI, a bearish MACD crossover, or bearish Stochastic divergence may reinforce the bearish signal.
- Support Level Break: Watch for a break below a key support level after the three black crows form. This can further validate the downtrend, indicating that sellers are gaining control.
- Bearish Candlestick Patterns: Additional bearish patterns, such as engulfing or dark cloud cover, emerging after the three black crows, can reinforce the likelihood of a sustained downtrend.
- Moving Averages: A cross of a short-term MA below a long-term MA can offer further confirmation of a bearish reversal.
Common Mistakes When Trading the Three Black Crows Pattern
In 3 black crows trading, it's common to make several mistakes that may lead to poor results or false signals. Here are key pitfalls to watch out for:
- Ignoring Volume: Failing to check for a rise in volume during the formation of the three black crows can lead to misinterpreting the pattern. Low volume may indicate weak selling pressure and an unreliable signal.
- Trading Without Confirmation: Jumping into a trade as soon as the pattern forms without using additional confirmation tools like momentum indicators or support breaks can increase the risk of a false reversal.
- Overlooking Market Context: The three crows candlestick pattern works in specific conditions. If the pattern appears in a sideways or range-bound market, it may not signal a true trend reversal, leading to misinterpretation.
- Setting Tight Stop-Losses: Placing stop-loss orders too close to the first candlestick’s high can result in early exit due to market noise. Proper risk management with room for fluctuations is essential.
- Neglecting Trend Strength: Ignoring the strength of the prior uptrend may lead to premature trades. The pattern is believed to be the most effective after a prolonged uptrend; using it in weak trends can result in false signals.
Final Thoughts
The three black crows pattern is a powerful bearish reversal signal that can help traders identify potential downtrends after a sustained uptrend. By understanding its formation, confirming the pattern with additional technical indicators, and implementing sound risk management strategies, traders can incorporate this pattern into their trading plans. However, as with any trading strategy, patience and proper confirmation are key to avoiding false signals.
Once you have practised identifying the black crows, consider opening an FXOpen account to start your trading journey!
FAQ
What Do 3 Black Crows Mean in Trading?
The 3 black crows’ meaning refers to a candlestick pattern signalling a bearish reversal. It consists of three consecutive long bearish candlesticks following an uptrend, indicating that sellers are taking control of the market. This pattern suggests a potential shift in momentum from bullish to bearish, meaning the price is likely to decline further as selling pressure increases.
What Do Three Black Crows Indicate?
The 3 black crows’ candlestick formation, after a prolonged uptrend, indicates a potential downside reversal. It means that sellers are taking control, and the price will likely trade downwards.
What Is the Success Rate of the 3 Black Crows?
The success rate of the three black crows pattern varies depending on market conditions, timeframe, and confirmation tools used. While it is generally considered a reliable bearish reversal signal, traders often use volume, momentum indicators, and support level breaks to confirm the pattern and improve success rates.
What Is the Meaning of Identical Three Crows?
The identical three crows is a variation of the traditional pattern. In this case, the three bearish candles open at the close of the previous candlestick, showing even stronger bearish pressure. This variation suggests that sellers are overwhelming buyers consistently, signalling an even more pronounced reversal.
How Do You Trade Three Black Crows?
To trade the 3 black crows pattern, traders wait for confirmation of a bearish reversal after the three consecutive down candles in an uptrend. They enter a short position once the pattern is completed and confirmed by additional indicators like increased volume or a break below support. They may place a stop-loss order above the high of the first candle and target key support levels below for profit-taking. Traders always manage risk carefully by using stop-losses and monitoring market conditions.
Are Three Black Crows Bullish?
No, the three black crows pattern is not bullish; it is a bearish candlestick pattern. It signals a potential reversal from an uptrend to a downtrend, indicating that selling pressure is starting to overwhelm buying pressure.
This article represents the opinion of the Companies operating under the FXOpen brand only. It is not to be construed as an offer, solicitation, or recommendation with respect to products and services provided by the Companies operating under the FXOpen brand, nor is it to be considered financial advice.
Stay ahead of the market!
Subscribe now to our mailing list and receive the latest market news and insights delivered directly to your inbox.


Latest articles

Weekly Market Insights with Gary Thomson: The Week of Central Banks and Earnings
In this video, we’ll explore the key economic events and market trends, shaping the financial landscape. Get ready for insights into financial markets to help you navigate the week ahead. Let’s dive in!
In this episode of Market

Intel at a Crossroads: Earnings Beat Meets Technical Resistance
Intel has just delivered its strongest quarter in over fifteen years, and the market reaction says it all. Q2 2026 revenue surged 25% year-over-year to $16.1 billion, crushing the consensus estimate of $14.42 billion, while adjusted EPS of

Tesla: Complex Range Structure Breaks Down Following Quarterly Earnings
Tesla released its Q2 2026 results after the market closed on 22 July. Revenue increased 26% year-on-year to $28.24 billion, while vehicle deliveries reached a record 480,126 units. However, operating margin fell sharply to 1.4%, down from