


How to Use Volumes to Improve Your Trading
FXOpen
Volume is one of the most basic indicators that traders encounter. While it’s regularly overlooked in favour of more sophisticated indicators, volume analysis is a powerful tool that can help traders gauge trends, spot reversals and confirm breakouts. In this article, we’ll discuss the basics of trading volume, how to interpret it, and show you some popular volume-based indicators.
What Are Trading Volume Indicators in Technical Analysis?
Trading volume refers to the total number of units traded for a particular asset over a specified period. For forex pairs, volume is expressed in lots; for stocks, it measures the number of shares changing hands; and in Contract for Difference (CFD) markets, it’s the number of contracts being traded.
Volume is a crucial piece of information for traders, as it helps them gauge the strength of price movements, assess liquidity, and measure market sentiment. Generally speaking, higher volume implies increased activity and attention and may signal that volatility is about to enter the market.
In practice, volume is typically represented by bars at the bottom of a trading window. A given candle will also have a corresponding volume bar, which usually changes colour depending on how the candle closes. For example, if an asset closes above the opening price of its candle, the candle and volume bar will both be green.

Beyond the standard volume indicator, there are other tools that interpret and plot volume in different ways. These indicators often present the volume data in the form of charts, histograms, or oscillators, making it easier to spot trends, reversals, and breakouts.
How to Use Volume in Trading
First, let’s look at three of the most common ways to use a volume indicator in technical analysis: confirming trends, identifying reversals and breakouts, and analysing liquidity and market sentiment.
Confirming Trends
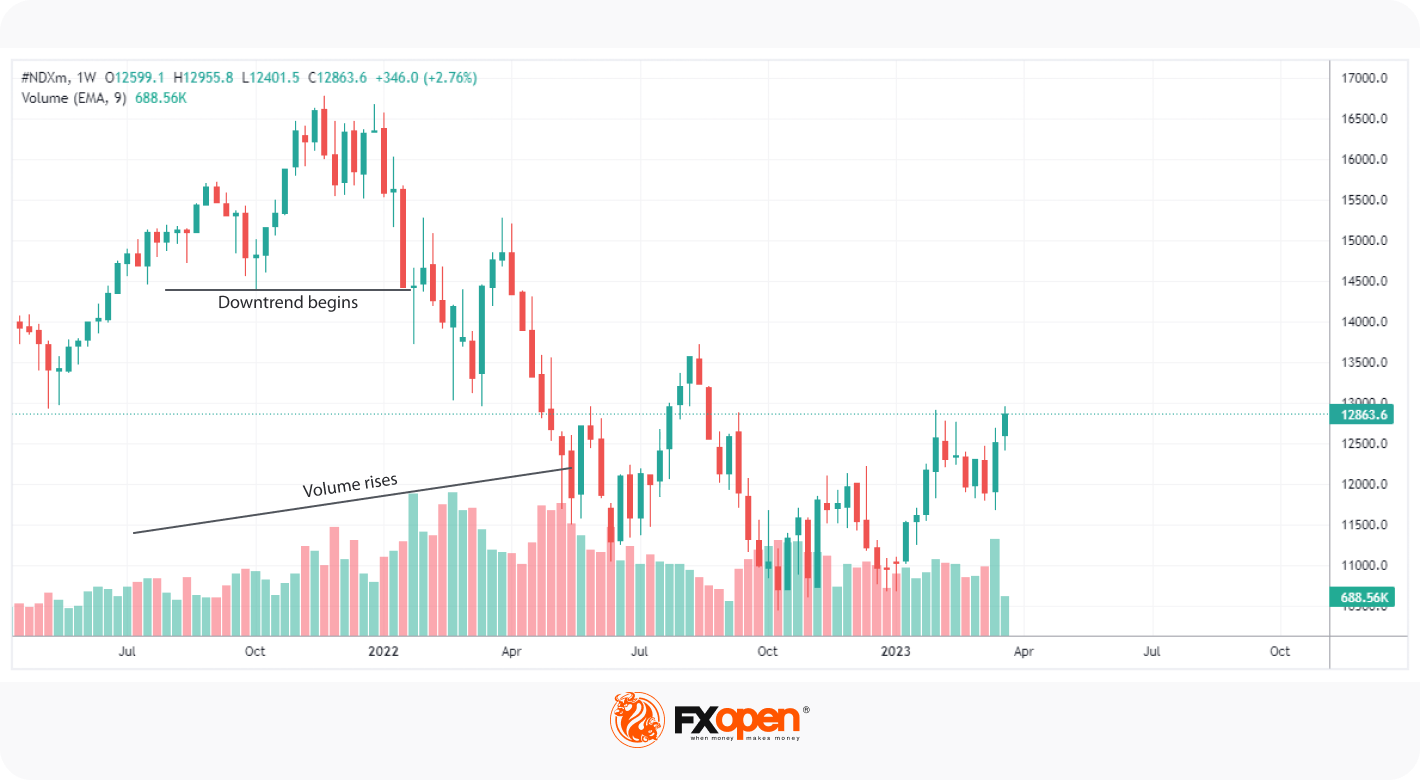
One of the most effective uses of volume is for confirming a price trend. When a movement is accompanied by a high volume, it suggests that the market believes the trend will continue. Conversely, if a price movement occurs on a low volume, it may mean a lack of conviction, indicating that a trend might be weak and that a reversal could be imminent.
The easiest way to think about this is in terms of supply and demand. In a hypothetical bull trend, demand will outweigh supply. When the trend first begins, demand might be high, causing the trend to progress upward on strong volume. As the asset becomes increasingly expensive, demand falls, leading to a drop in volume.
Identifying Reversals and Breakouts
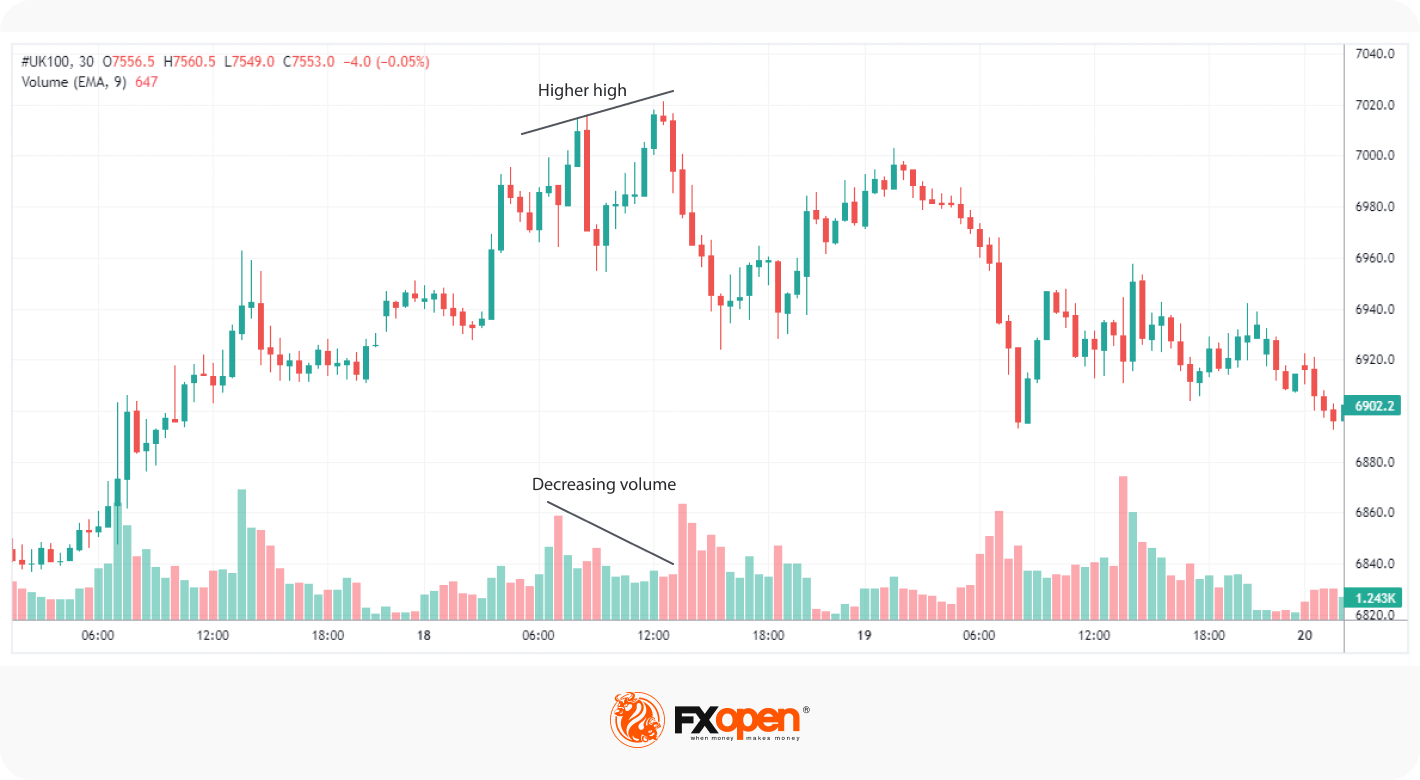
Traders also often use volume to spot potential reversals and breakouts. As described, decreasing volume in a trend can signal that a reversal is inbound. When this lines up with a critical support/resistance level, traders can begin to anticipate that a reversal is likely to occur. Similarly, when an asset breaks through a key support or resistance level on a strong volume, it suggests that the breakout may continue in that direction.
Analysing Liquidity and Market Sentiment
Volume is also essential for assessing an asset’s liquidity. High volume implies high liquidity, making it easier for traders to enter and exit positions without slippage or high spread costs. On the other hand, an asset with low volume and liquidity may be more susceptible to sudden volatility and greater costs.
For most forex traders, liquidity is usually not an issue, especially in major pairs. But for stock traders, low liquidity can cause issues like being stopped out prematurely or struggling to enter/exit at their preferred price.
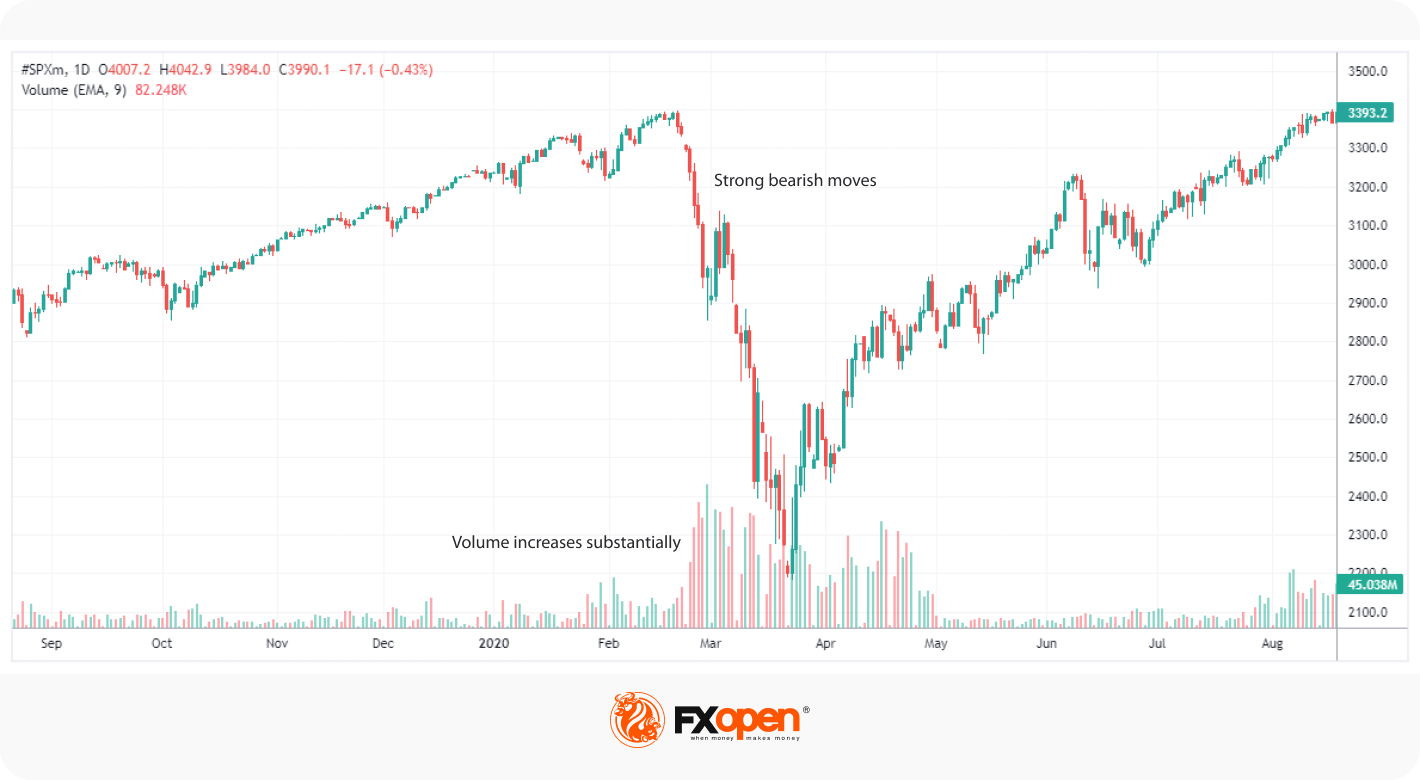
Lastly, analysing volume can provide insights into market sentiment, revealing whether most traders are bullish or bearish. For example, the start of the 2020 Coronavirus market crash saw volume increase significantly in the S&P 500, well beyond levels seen over the previous year. This was a sign to traders that sentiment had become extremely bearish.
Popular Stock Volume Indicators
Beyond the regular volume bars, there are several volume indicators frequently used by traders. These aren’t just day trading volume indicators or limited to stocks. Instead, they can be applied to a wide range of markets across virtually any timeframe.
Accumulation/Distribution (A/D)
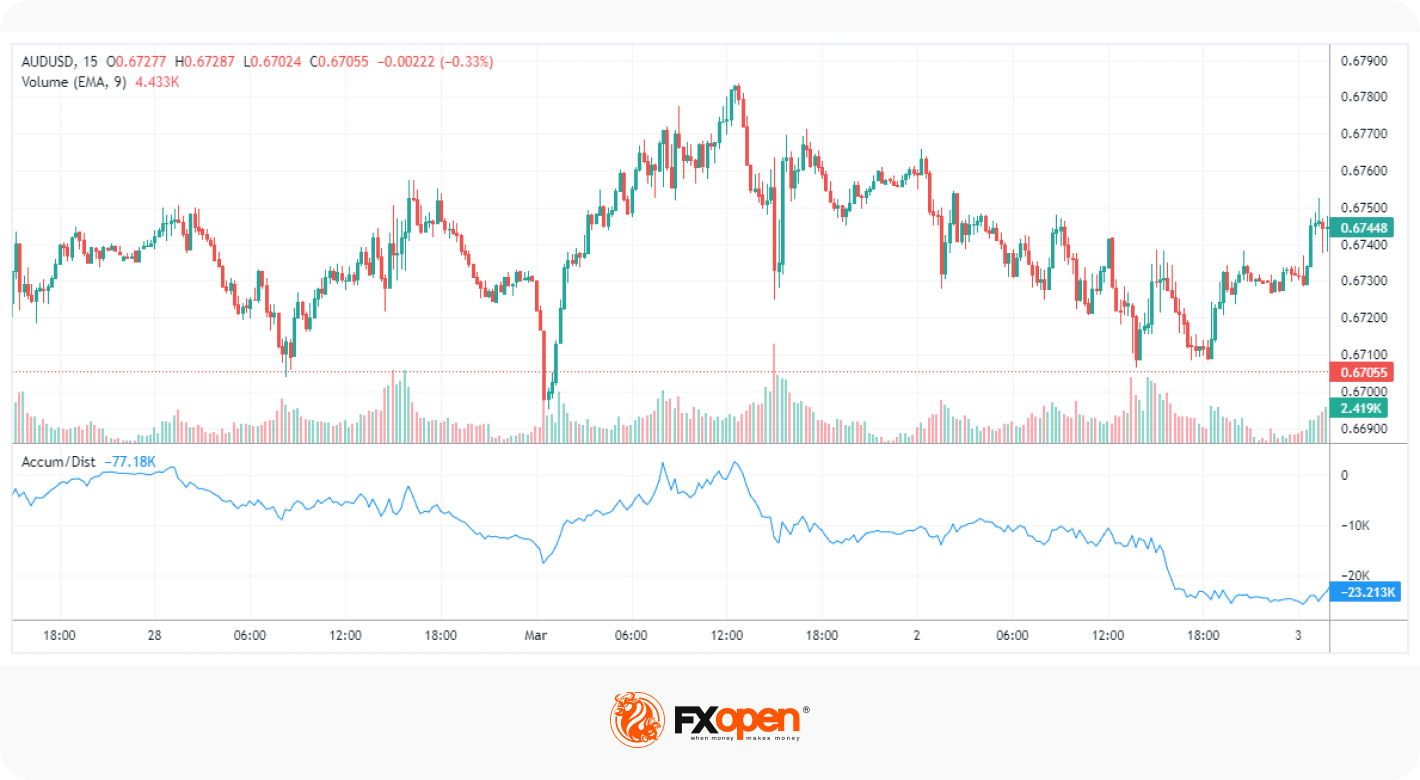
The Accumulation/Distribution (A/D) index, developed by Marc Chaikin, is designed to measure the cumulative flow of money in and out of an asset. It helps traders identify whether a stock is being accumulated (bought) or distributed (sold) by the market participants.
The A/D line is calculated by adding or subtracting a measure of volume, depending on the relationship between the closing price and the high and low prices of the day. When the A/D line rises, it signals that buying pressure is strong, while a declining A/D line indicates selling pressure. Divergences between the A/D line and an asset’s price can also be used to spot potential trend reversals.
Chaikin Money Flow (CMF)
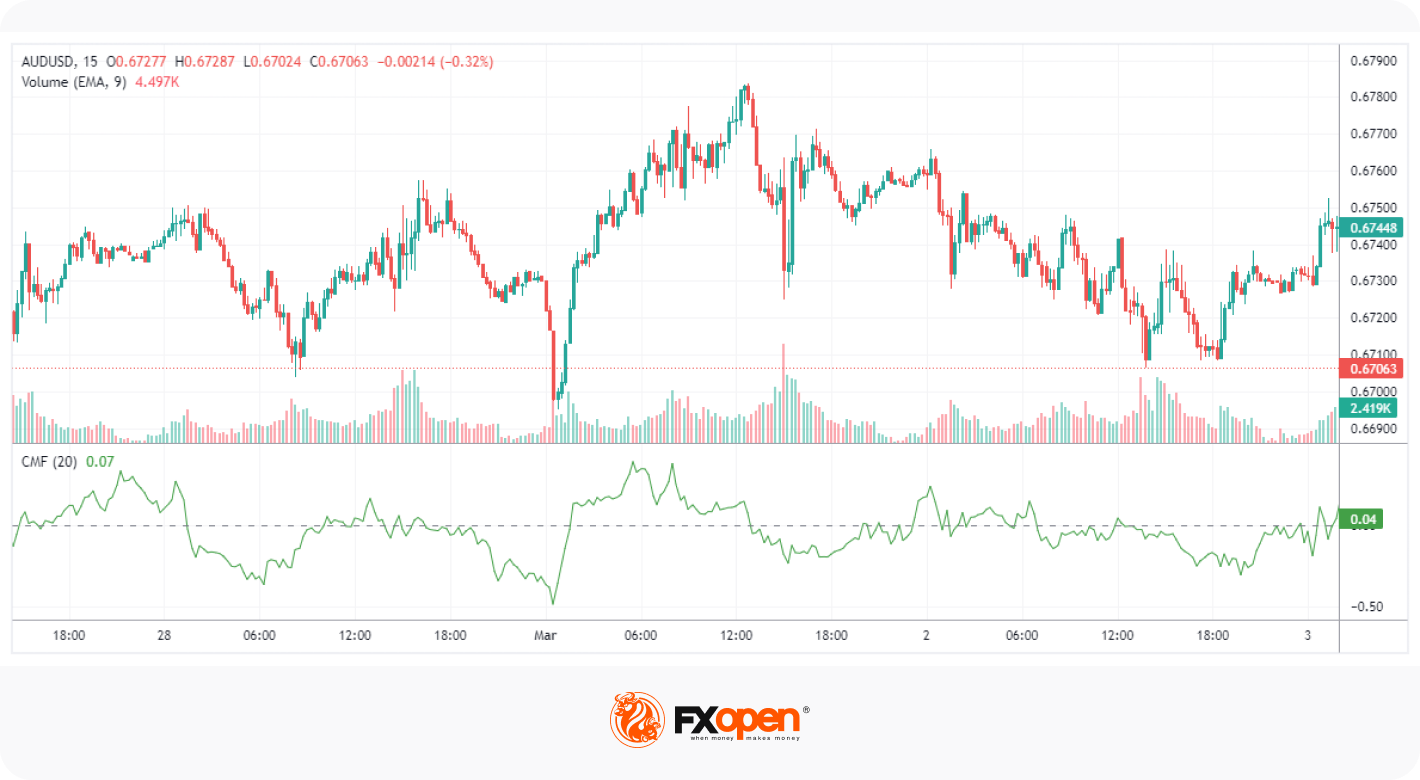
The Chaikin Money Flow (CMF) indicator, also developed by Marc Chaikin, takes the A/D line a step further. It calculates an average of the A/D values over a specific period, typically 20 or 21 days, then divides the figure by the average volume from the same period. This results in a volume average indicator that oscillates between 0 and 1.
Generally, a positive CMF value indicates more buying than selling pressure, suggesting a bullish market sentiment. In contrast, a negative CMF value implies more selling pressure, demonstrating bearish sentiment.
Traders can use the CMF to identify potential trend reversals, confirm price breakouts, and spot divergences. Its versatility and sensitivity to market movements have led many to consider it one of the best volume indicators for day trading.
On-Balance Volume (OBV)
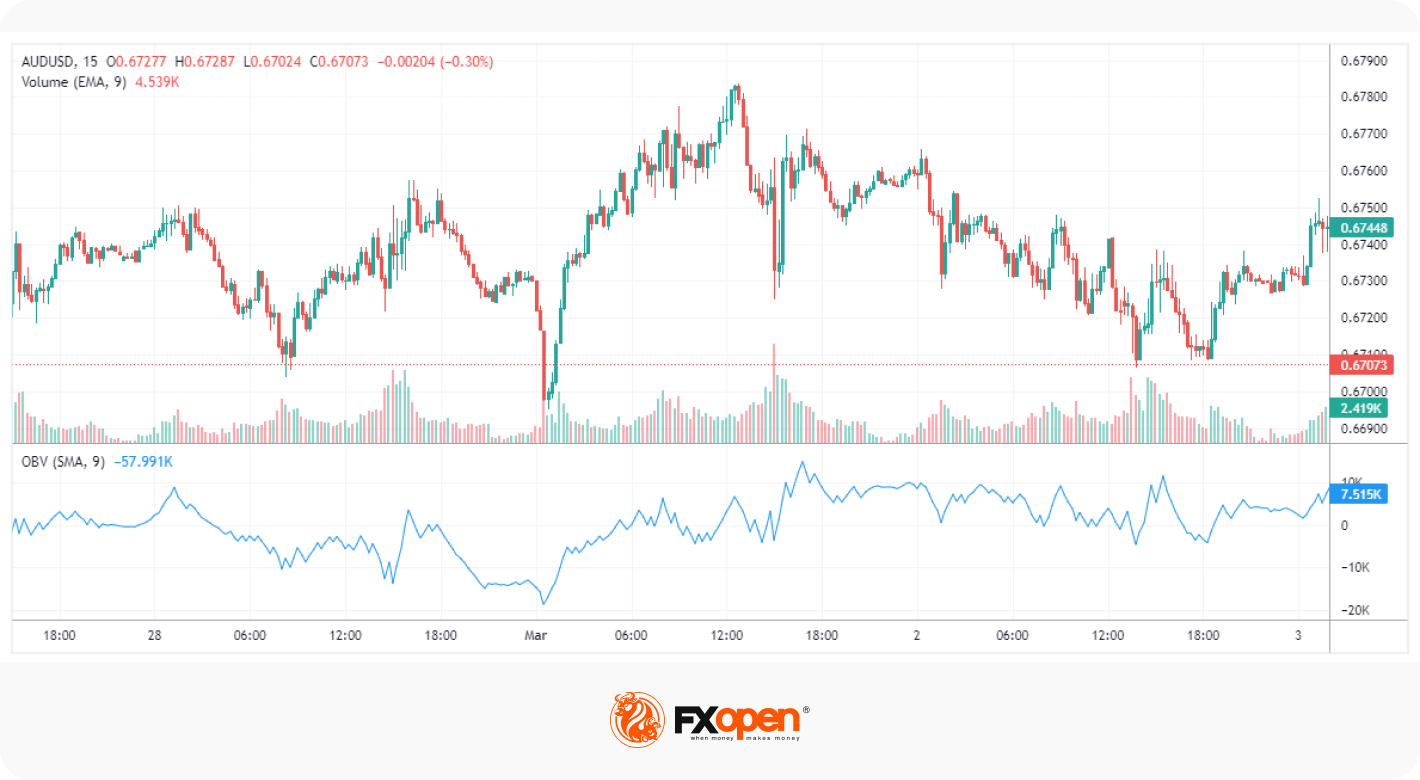
On-balance volume (OBV) is a cumulative volume indicator developed by Joe Granville in the 1960s. It adds or subtracts a candle’s trading volume based on whether the asset closes above or below the previous candle. The main idea behind OBV is that volume precedes price, and significant changes in OBV with little price movement can be a sign of a potential move.
When plotted, OBV looks similar to the A/D indicator. However, its movements tend to be sharper and more defined, which means it can produce more signals than A/D. Like A/D, a rising OBV line suggests that buying pressure is outpacing selling pressure, indicating that the price may continue on a bullish trend. It’s also a powerful tool for spotting divergences between price and volume.
Is A/D or OBV the better buy and sell volume indicator? Ultimately, the answer is subjective and depends on the individual trader. Your best bet is to apply both to a chart and observe their differences. You’ll find both indicators, alongside dozens of other tools, in the free TickTrader platform we offer at FXOpen.
Common Mistakes to Avoid When Trading with Volume
Like all market indicators, volume isn’t a silver bullet. While it can help traders to make predictions and confirm movements, there are a couple of key mistakes to avoid when trading volume in a strategy.
Misinterpreting Volume Spikes
One of the biggest pitfalls is misinterpreting sudden spikes in volume. While high volume can indicate a strong trend or the start of a reversal, it’s also wise to be cognisant of the wider context before making a decision to enter a trade. Singular events, like earnings announcements, news releases, or market rumours, can cause spikes in volume.
For instance, Federal Reserve interest rate decisions often lead to significant volume entering the market. While the decision may cause a sharp spike in price and volume, the asset can just as easily reverse and take off in the other direction as traders digest additional information. In other words, a volume spike may not necessarily signal a sustainable trend. In these scenarios, waiting for the dust to settle and looking for additional factors to support your bias is best.
Overreliance on Volume Data
Another mistake to avoid is relying too heavily on volume data alone. While analysing volume is a valuable tool, it should form part of a broader strategy supported by other technical indicators.
Volume is a leading indicator, as are the other indicators listed in this article, meaning it can help traders predict future price movements. Therefore, it’s best to pair volume analysis with a lagging indicator, like moving averages or Bollinger Bands, which can confirm a trader’s prediction.
For instance, you could look for divergences between price and volume, anticipating a reversal. Once you set a bias, wait for a moving average crossover to confirm the trend and enter in that direction. In doing so, you now have extra confirmation that your prediction was correct.
Your Next Steps
You now have a comprehensive overview of volume and how it can be a valuable addition to any trading strategy. Wondering what your next steps should be? You can try this:
- Hop on the TickTrader platform and observe the relationship between volume and price, especially during trends, reversals and breakouts.
- Test out the three indicators listed in this article. If you find one that you like, search for further resources to expand your knowledge.
- Backtest a volume trading strategy, logging your results and adjusting your system as you go.
- Feel ready to put your skills to the test? Open an FXOpen account and put your strategy to work.
This article represents the opinion of the Companies operating under the FXOpen brand only. It is not to be construed as an offer, solicitation, or recommendation with respect to products and services provided by the Companies operating under the FXOpen brand, nor is it to be considered financial advice.
Stay ahead of the market!
Subscribe now to our mailing list and receive the latest market news and insights delivered directly to your inbox.


Latest articles

EUR/USD: All Eyes on the Fed as the Range Reaches Its Breaking Point
The dollar's next move hinges on tonight's Fed decision, and this time markets genuinely don't know what to expect. While economists still lean toward a hold—with CME FedWatch odds sitting near 68.5% for no change—Kevin Warsh's hawkish

USD/JPY and USD/CAD Test Resistance Ahead of Fresh Fed Signals
The US dollar continues to hold the upper hand against most major currencies ahead of the outcome of the latest Federal Reserve meeting. While the base-case scenario remains for interest rates to stay unchanged, markets are also pricing in the

Amazon Earnings: Does the Chart Already Know Something the Numbers Don't?
All eyes are on July 30, when Amazon reports Q2 2026 earnings, with Wall Street increasingly convinced the bar has been set too low. Consensus sees EPS near $1.82-$2.26 on roughly $197 billion in revenue, but the