


Identifying Trending and Range-Bound Currencies
FXOpen

In the dynamic world of forex trading, recognising trending and range-bound currencies is crucial for making informed trading decisions and designing effective strategies. This article delves into the fundamentals of identifying these two types of market conditions in forex trading.
Understanding Trending Currencies
Understanding what constitutes a trending currency and how to recognise it through technical analysis is the first step towards trading.
Identifying Trends
A trending currency is one whose price consistently moves in a particular direction over a specified period. This movement is typically characterised by higher highs and higher lows and is called an uptrend, or lower highs and lower lows and called a downtrend. Trendlines are indispensable tools for identifying the direction of a trend. These lines are drawn by connecting the lows and highs. Whenever a clear depiction of trend direction emerges, it aids traders in making informed decisions when analysing major currencies in forex.
Technical Indicators for Trending Currencies
Identifying trending currencies through technical analysis tools is a nuanced process. In addition to trendlines, traders also leverage various technical indicators, such as Moving Averages (MAs), to smoothen price data and reveal underlying trends. On most traded currencies’ charts, traders determine the trend by looking at the movement of the market relative to the MA lines. The Relative Strength Index (RSI) may confirm trends breaking above and below 50, while the Moving Average Convergence Divergence (MACD) offers additional layers of confirmation by assessing momentum and crossovers.
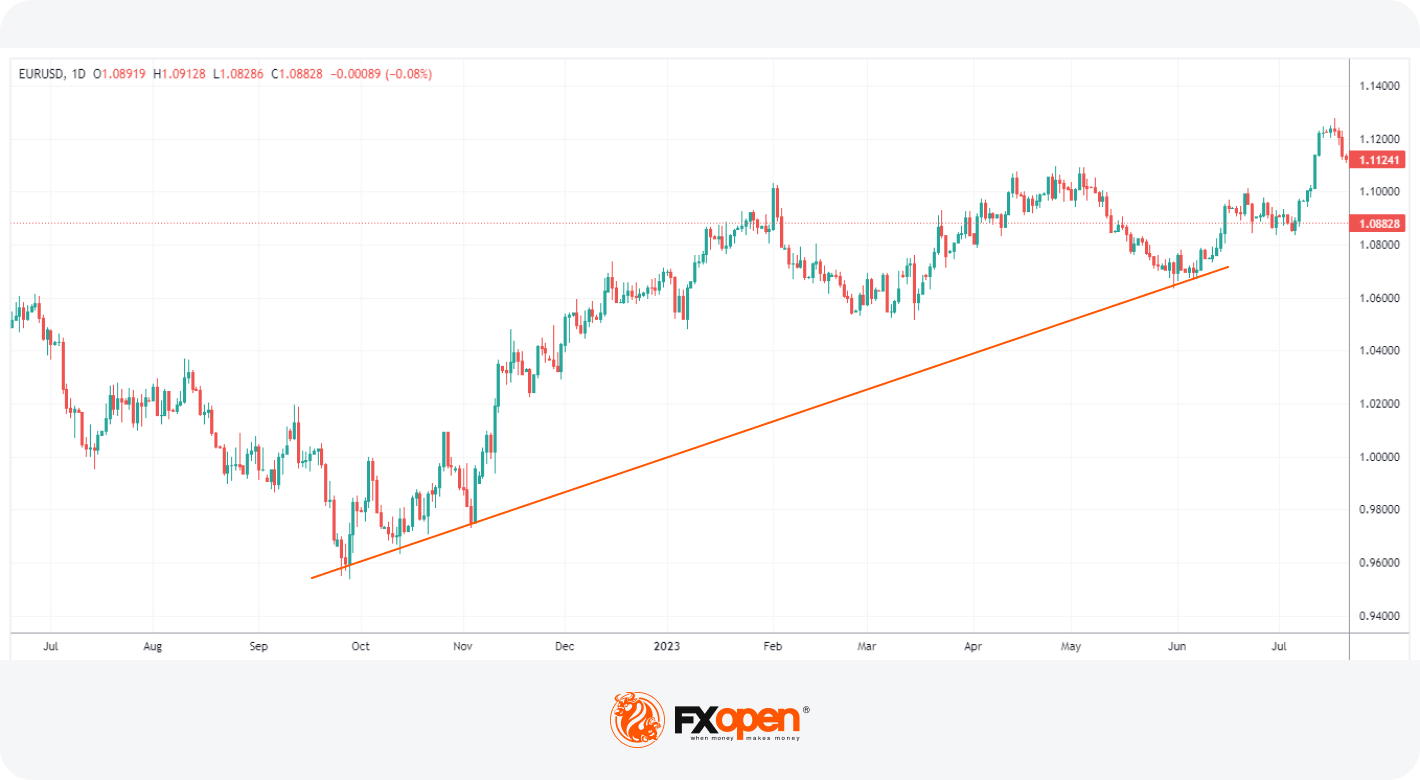
Example of a Trending Currency Pair
The chart below depicts the most liquid currency pair - EUR/USD - showing that it was moving in an uptrend within the specified period.
Looking for innovative opportunities to take advantage of the most traded currencies by value? You can visit FXOpen and trade on our free TickTrader trading platform.
Recognising Range-Bound Currencies
While trending currencies showcase clear directional movements, range-bound currencies exhibit sideways price action within a certain range. Identifying and understanding range-bound markets when looking for the top currencies to trade is essential for adapting appropriate trading strategies.
Identifying Range-Bound Markets
Support and resistance levels serve as fundamental pillars in recognising and understanding range-bound markets. Support represents the price level at which a currency tends to halt its descent, forming a metaphorical floor that prevents further declines. Conversely, resistance signifies the price level at which a currency encounters a barrier, acting as a metaphorical ceiling that prevents prices from rising further. In the context of a range-bound market, these support and resistance levels become defining boundaries. The market price tends to fluctuate within this range, creating a horizontal channel where neither a strong upward nor downward trend dominates.
Technical Indicators for Range-Bound Markets
Several indicators are valuable tools for identifying range-bound markets in forex trading. Bollinger Bands, with their central moving average and upper/lower bands, signal range-bound conditions when prices fluctuate sideways between them. The Relative Strength Index (RSI) may oscillate between overbought and oversold levels in a range-bound market. The Average Directional Index (ADX) confirms that a currency is moving within a trading range when it has lower values, suggesting the absence of a trend. Combining these indicators provides traders with a comprehensive toolkit to recognise and navigate range-bound conditions effectively.
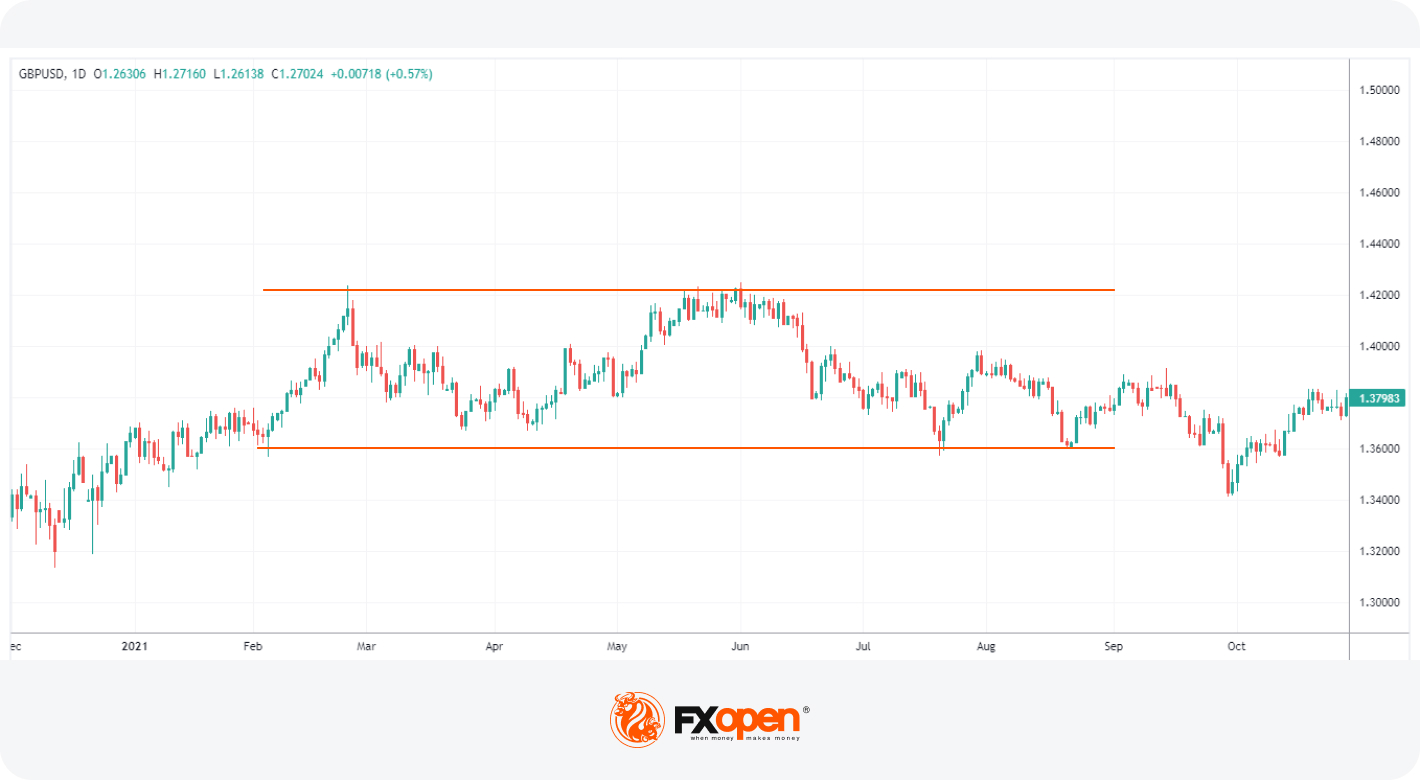
Example of a Range-Bound Currency Pair
The chart below depicts the GBP/USD currency pair, trading in a range with no clear trend within the specified period.
Factors Influencing Currency Trends and Ranges
The dynamics of currency markets are shaped by a multitude of factors that require a profound understanding of effective trading strategies. Economic indicators, encompassing variables such as employment rates, inflation, and GDP, play a pivotal role in influencing currency valuations. A deep analysis of these indicators provides traders with insights into the overall economic health of a country, enabling them to anticipate potential shifts in currency values.
Geopolitical events further add complexity to the landscape, as political developments, trade agreements, and international relations can significantly impact currency movements and initiate or prevent the formation of trends. The collective psychology of traders also often dictates short- and long-term forex rate movements.
Combining Methods for Accuracy
Achieving precision in identifying trends or ranges requires a judicious fusion of technical and fundamental analysis, each contributing unique perspectives to the trader's toolkit. Technical analysis, with its emphasis on historical price movements, involves the study of chart patterns, trendlines, and various indicators such as moving averages and oscillators. This method enables traders to discern patterns and potential trend reversals, providing a granular understanding of market behaviour.
On the other hand, fundamental analysis examines the macroeconomic landscape that underpins currency valuations. Key economic indicators are scrutinised to gauge the overall health and stability of a nation's economy. By seamlessly integrating technical and fundamental analyses, traders gain the ability to make more informed predictions about potential future price movements.
Additionally, traders keen on anticipating and reacting swiftly to changes in market conditions should also gauge the prevailing sentiment through tools such as sentiment analysis and news sentiment indicators.
Takeaway
Successfully navigating the forex market requires the skill to distinguish trending from range-bound price movements in currency pairs. By employing trendlines, technical indicators, and a combination of analytical methods, traders can enhance their ability to identify and capitalise on these market opportunities. You can start implementing your new skills right away by opening an FXOpen account!
This article represents the opinion of the Companies operating under the FXOpen brand only. It is not to be construed as an offer, solicitation, or recommendation with respect to products and services provided by the Companies operating under the FXOpen brand, nor is it to be considered financial advice.
Stay ahead of the market!
Subscribe now to our mailing list and receive the latest market news and insights delivered directly to your inbox.


Latest articles

NZD/USD Analysis: A Tug-of-War at the Critical Level
The kiwi has strengthened meaningfully against most peers this month. However, against the US dollar specifically, NZD/USD remains well below its 2026 highs, trading in the mid-0.58 area versus January's peak near 0.6075.
New Zealand's Q2 inflation

AUD/USD and USD/CAD React to Rising Geopolitical Risks
Commodity-linked currencies remain under pressure as geopolitical tensions in the Middle East continue to escalate. The United States has maintained strikes on targets in Iran, while the Tehran-backed Houthis have intensified threats to shipping in the Red Sea and near

GBP/CHF: Trendline or RSI — Which One Is Lying?
Sterling enters this week on firmer footing, with political uncertainty fading fast after Andy Burnham's confirmation as Labour leader eased investor concerns over the succession to Keir Starmer. Markets reacted further to reports pointing to Shabana Mahmood as the frontrunner