Impulse Wave Pattern with Elliott Waves Theory
One of the most intriguing technical analysis theories, Elliott Wave traces its roots in the first half of the 20th century. Ralph Elliott built a complex trading theory on the assumption that the stock market is the sum of human emotions like optimism and pessimism, fear and greed.
He discovered that the market moves in cycles and each cycle has a different degree, depending on the time horizon used to analyze it. More importantly, Elliott divided each cycle into two distinct parts: impulsive and corrective.
What Is an Impulse Wave Pattern?
Impulse wave are the reason why today’s retail traders use the Elliott Waves theory to trade the currency market. During impulse activity, the market rallies sharply, rewarding traders on the right side of it with handsome profits.
One of the rules of the theory says that impulse waves are represented with letters. And, any impulse wave is a five-wave structure.
Using this basic rule, we can say that the correct labeling of an impulse wave is 1-2-3-4-5. Therefore, from now on, whenever you see a number on an Elliott Waves count, that number belongs to an impulse wave pattern.
The beauty (and complexity at the same time) of the Elliott Waves Theory is that each wave part of an impulse wave is an impulse or corrective wave on its own. The secret is to interpret them as being waves of different degrees.
For instance, take the first wave. It must be impulse on its own, meaning that its structure is another 1-2-3-4-5 but this time of a lower degree.
The price action that follows the first wave cannot retrace beyond its start. That’s forbidden in the theory, and it is one of the things that separate the impulse from the corrective activity.
Put it simpler; the second wave cannot retrace beyond the first wave’s start. In sharp contrast with the first wave’s structure, the second wave is corrective, and not impulse. In other words, everything discussed in this article about an impulse wave does not apply to the second wave.
Typically, the second wave retraces somewhere between 50% and 61.8% of the first wave. This is the place where traders in search of the third wave enter the market, placing a stop-loss at the start of the first wave and targeting the extended wave.
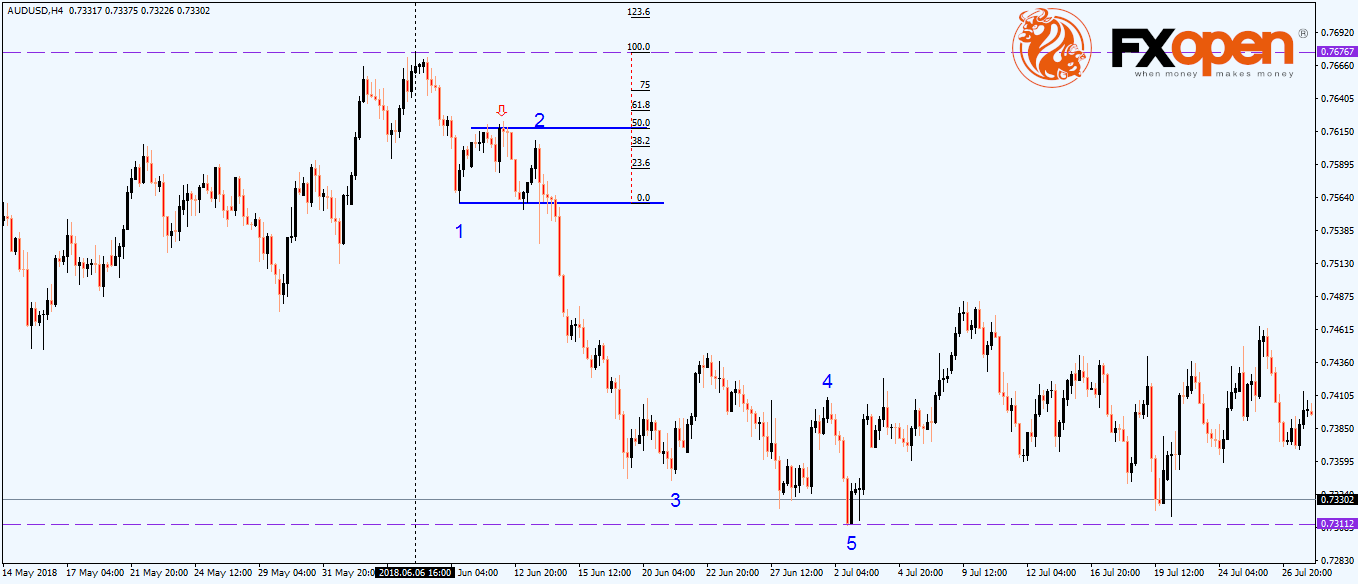
An extension is mandatory with any impulsive wave, and the minimum distance for the price to travel is 161.8% of the previous wave. The best candidate for an extended wave with the Elliott Waves theory is the third wave, making it a popular trading setup for today’s online retail traders.
Speaking of the third wave, this one is impulsive on its own and cannot be the shortest when compared with the first and the fifth wave.
The fourth wave is corrective, and typically it alternates in structure and complexity with the other corrective wave in the impulsive pattern. The favorite way to trade the fourth wave is to measure the previous third wave, find the 38.2% retracement, and trade for a new high (in a bullish move) or low (in a bearish move) while having a stop-loss at the 61.8% level.
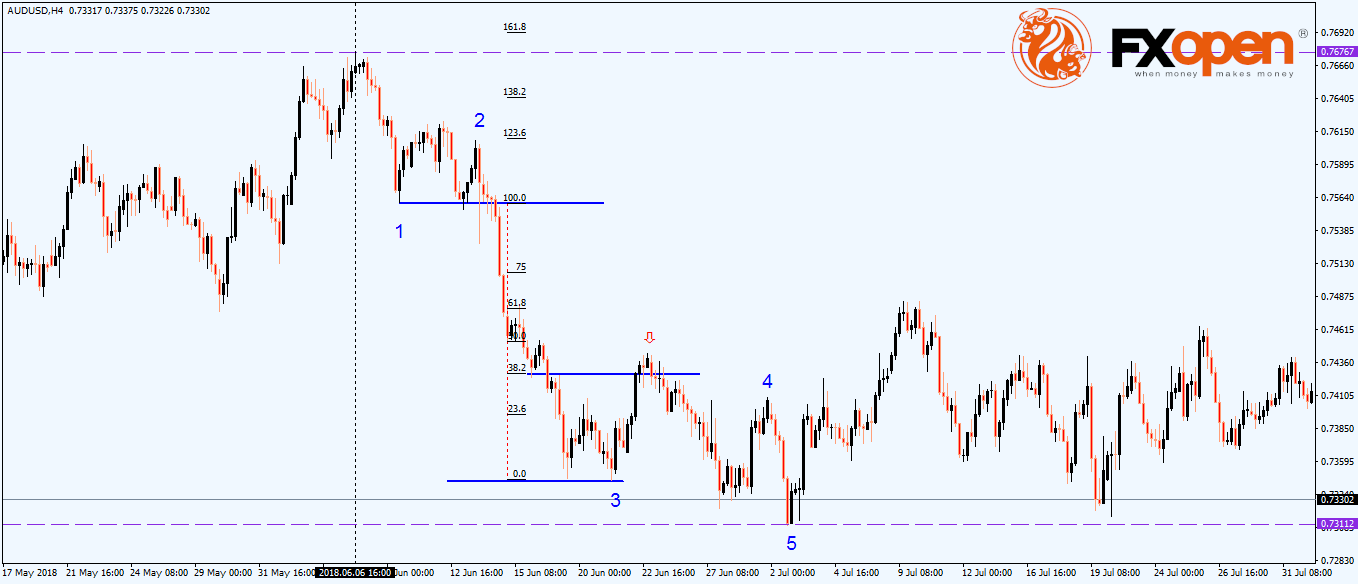
As for the fifth wave, almost always it forms a new high or low and is an impulse wave on its own. In the rare cases when it doesn’t make a new high or low, the market puts a significant top or bottom, in a pattern called a fifth wave failure.
Conclusion
The entire Elliott Waves Theory is just a set of patterns linked together with the ultimate goal of labeling the whole market. Elliott claimed that he discovered the “secret of the universe” by the time he released the second edition, a revised one, to the technical analysis society.
Almost a hundred years later, the theory remains a masterpiece of interpreting and trading the market based on the market participants’ behavior and psychology.