


FXOpen

Chart patterns are a vital part of price action trading. The bearish diamond formation is a visually striking configuration that can signal a forthcoming trend reversal. In this FXOpen article, we'll explore what the bearish diamond pattern is, how to identify it on a price chart, compare it to a bullish counterpart, and test a strategy for trading it effectively.
What Is a Bearish Diamond Trading Pattern?
A bearish diamond is a technical analysis pattern that typically appears during an uptrend and suggests a possible trend reversal to the downside. It resembles a diamond shape, with two trendlines diverging and converging.
This formation consists of four main components:
1. Initial Uptrend: The bearish diamond forms after a sustained uptrend, indicating that bullish sentiment may be weakening.
2. Upper Trendline (Resistance): This is a diagonal line connecting higher highs in the first part of the pattern and lower highs in the second. It acts as resistance, capping further upward movement.
3. Lower Trendline (Support): The lower trendline connects lower lows in the first part of the pattern and higher lows in the second, providing support and preventing prices from falling too quickly.
4. Shape: The diamond shape is created as the upper and lower trendlines diverge in the first part of the pattern and converge in the second. This narrowing price range indicates indecision in the market and a potential trend reversal.
How to Spot the Bearish Diamond Pattern in the Chart
Regardless of whether you look for a diamond pattern in stocks, forex, or commodities, to spot it in the chart, you will need:
- Uptrend Confirmation: Ensure that this occurs after a strong, long-lasting confirmed uptrend, as it provides a reversal signal.
- Draw Trendlines: Connect the highs and lows within the formation to create the upper and lower trendlines. These trendlines should diverge in the first part of the formation. Afterwards, the price should start forming lower highs and higher lows so the trendlines converge.
- Symmetrical Setup: The pattern should have a symmetrical appearance, with both trendlines having approximately equal length.
- Volume Analysis: Pay attention to trading volume. Typically, there should be a decrease in volume as the diamond forms, signalling market indecision.
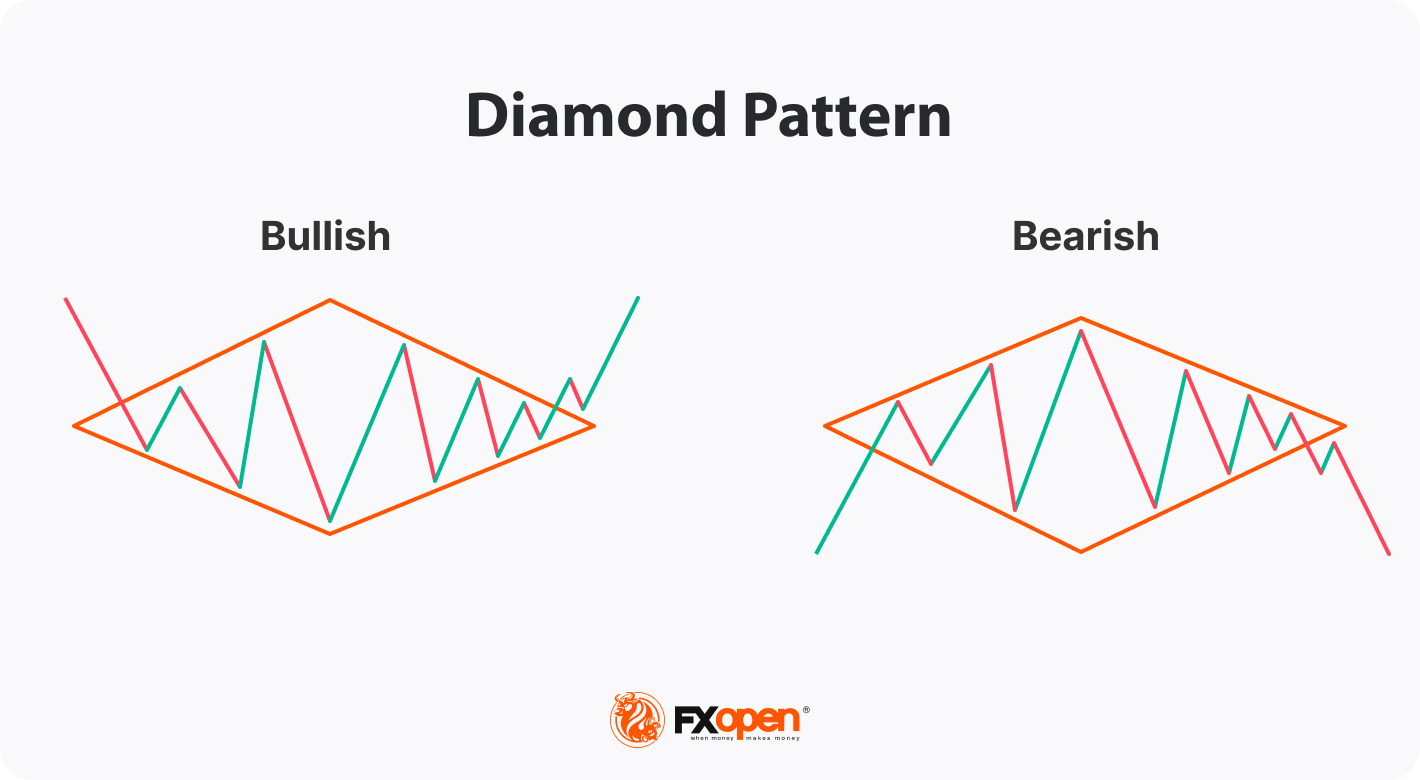
Bearish Diamond vs Bullish Diamond
It's essential to distinguish between bullish and bearish formations. While the bearish formation signals the potential reversal of an uptrend, the bullish one forms in a downtrend and suggests a potential bullish reversal. The key difference lies in the direction of the preceding trend and the implications for future price movement.
How to Trade the Bearish Diamond Pattern
Trading the bearish diamond involves considering entry points, take-profit levels, and stop-loss orders to manage risk effectively. You may use the following steps:
Entry:
- Enter a short position when the price breaks below the lower trendline of the fully-formed diamond shape, confirming the trend reversal. Some traders wait for a candlestick close below the lower trendline for added confirmation.
- Traders also pay attention to volume during the breakout. Increasing selling volume is supposed to confirm the strength of sellers.
Take Profit:
- Traders usually calculate a target price level based on the formation's height and project it downward from the point of the breakout. Alternatively, you may use support levels or other technical analysis tools to identify potential profit-taking points.
Stop Loss:
- A stop-loss order is usually placed above the recent high within the diamond to limit potential losses in case the trend continues. If you trade on long-term timeframes that feature strong, prolonged trends, you may consider adjusting the stop loss as the trade progresses to protect gains and minimise risk.
Live Market Example
Let's consider a forex diamond example. In a strong uptrend on the daily chart of the EUR/USD pair, a bearish diamond pattern formed. Traders noticed the narrowing price range, decreasing volume within the formation, and the breakout below the lower trendline. They could have entered short positions at the breakout point or at the following bearish candles when volumes increased. They could have set a take-profit level based on the nearest strong support where the market reversed last time (1) and placed a stop-loss order above the recent high (2) of the formation.
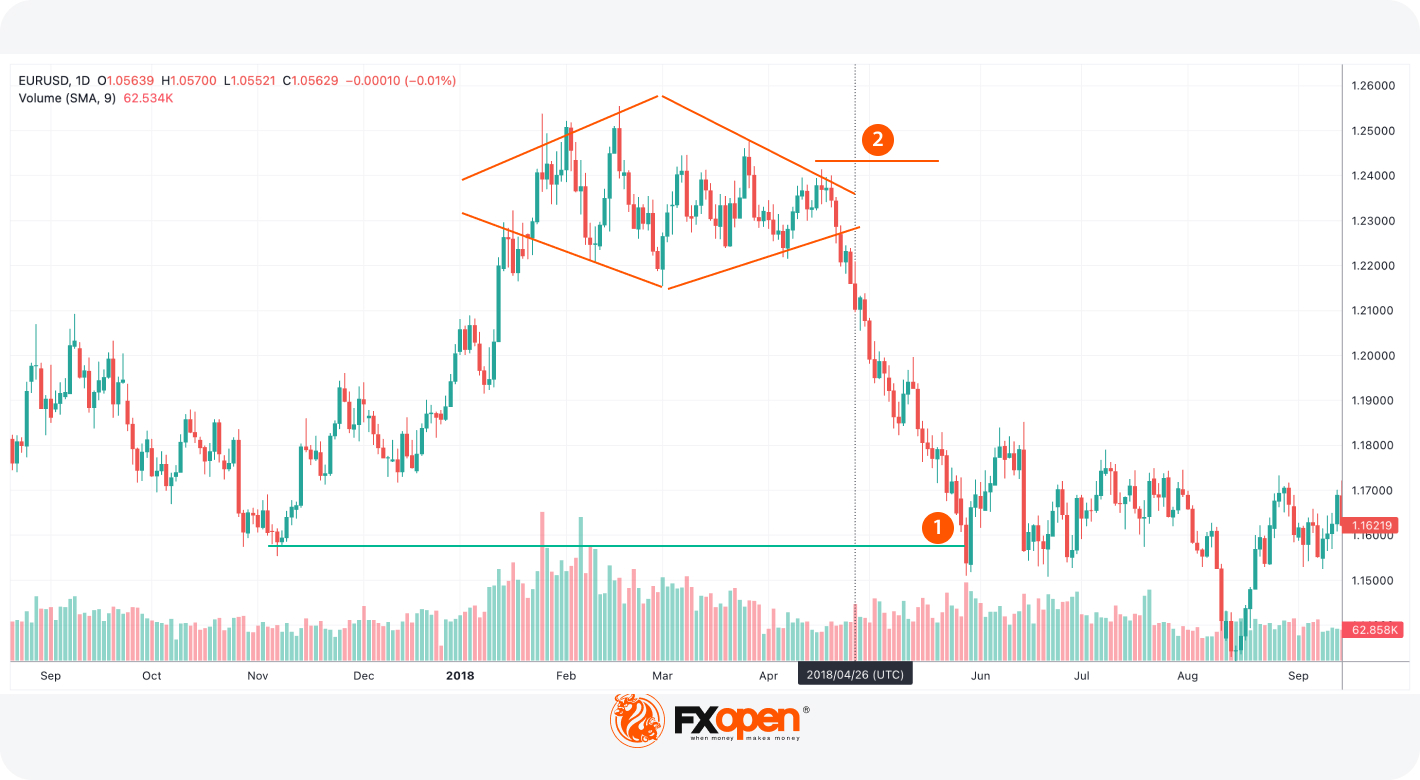
Chart patterns are highly practical and can be used in various markets. The diamond isn’t an exclusion. You can find diamond formations in stocks, commodities, cryptocurrencies*, and currency pairs. Register on the free TickTrader platform and learn how to determine diamond patterns in over 600 markets.
Final Thoughts
The bearish diamond formation in trading is a compelling tool that can aid traders in identifying potential trend reversals. However, like all trading patterns, it's not foolproof; therefore, traders use technical analysis indicators or equip themselves with fundamental analysis. By mastering the art of pattern recognition, traders can gain valuable insights into market sentiment and increase the effectiveness of their trades. If you want to test a trading strategy with the diamond, you can open an FXOpen account and enjoy tight spreads from 0.0 pips and low commissions from $1.50.
*At FXOpen UK and FXOpen AU, Cryptocurrency CFDs are only available for trading by those clients categorised as Professional clients under FCA Rules and Professional clients under ASIC Rules, respectively. They are not available for trading by Retail clients.
This article represents the opinion of the Companies operating under the FXOpen brand only. It is not to be construed as an offer, solicitation, or recommendation with respect to products and services provided by the Companies operating under the FXOpen brand, nor is it to be considered financial advice.
Stay ahead of the market!
Subscribe now to our mailing list and receive the latest market news and insights delivered directly to your inbox.


Latest articles

Gold Price Holds Near Key Support
As the XAU/USD chart shows, the gold price has been holding within the $5,060–$5,200 range over the past several sessions.
Bullish view: the key support is the lower boundary of the long-term channel that has been

EUR/USD Chart Analysis: Pair Rebounds from the Year’s Low
Analysing the EUR/USD chart five days ago, we:
→ constructed a downward channel, noting signs that the bears remained in control;
→ outlined a scenario in which the rate would decline to a new yearly low (and test the lower boundary

Dollar Index (DXY) Hits Yearly High
Today, the dollar index rose above last week’s peak around the 99.68 level, setting a new high for 2026. This movement is supported by a tense fundamental backdrop:
→ Inflationary pressures from rising oil prices. Markets may be pricing