


FXOpen

Financial markets around the world took a hit at the end of last week. The news that a new COVID-19 strain, found in South Africa, is even more contagious has triggered a flight to safety.
The renewed pandemic fears have suddenly sent the stock markets plummeting. Even more impressive, however, was the drop in the price of oil.
The WTI crude oil price dropped by more than 10%, and Brent settled down 11.55%. Oil prices have rallied in 2021 on the back of strong demand as the world’s economies reopened, and now investors are getting wary of new lockdowns and the market being oversupplied.
While the WTI crude oil price drop was strong enough to scare anyone with a long position, the technical picture remains bullish as the price holds above $60.
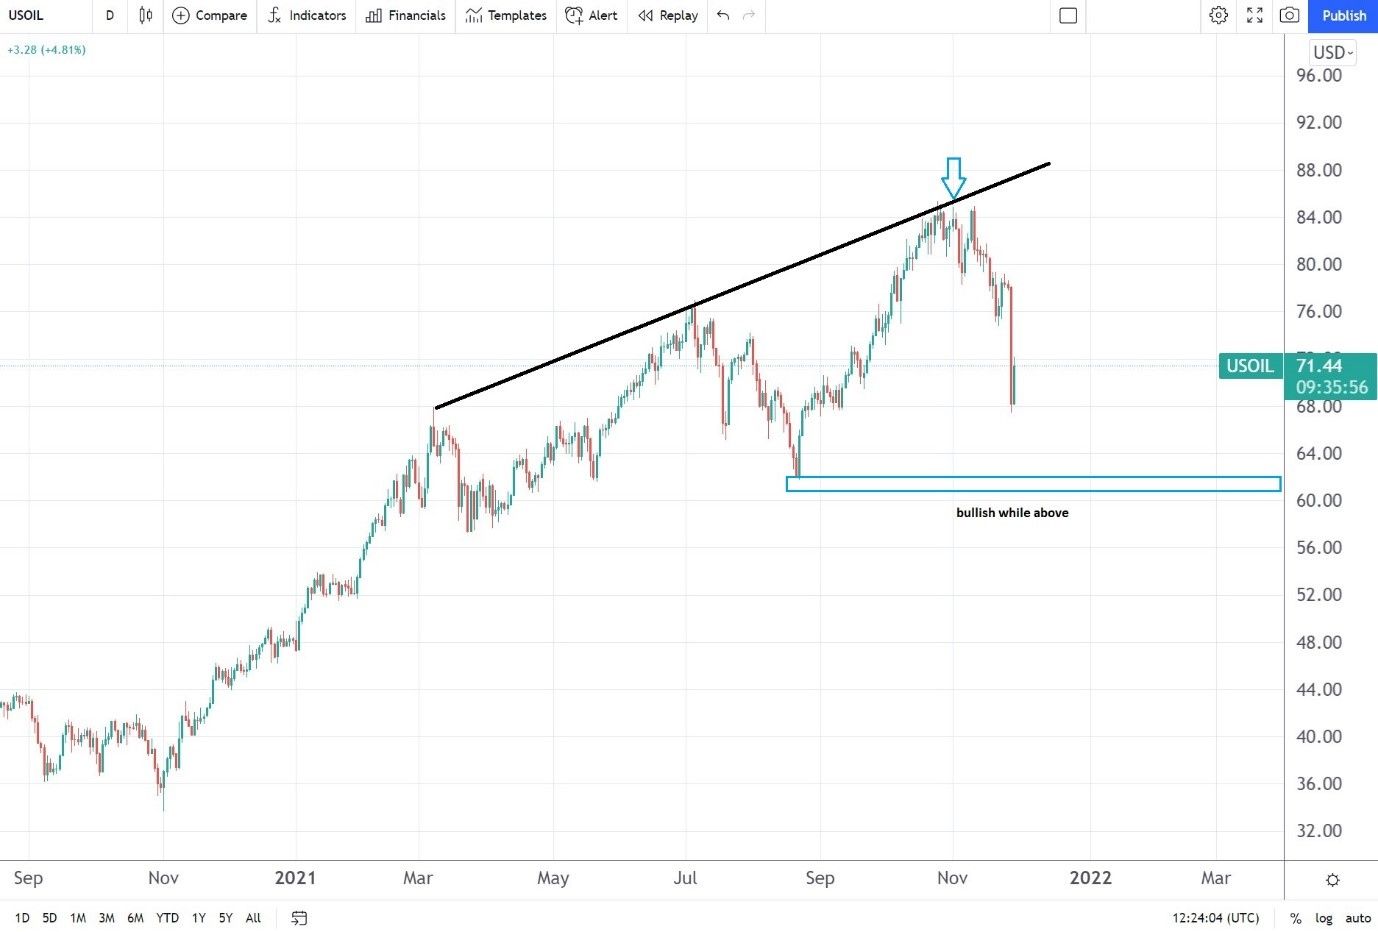
Bullish Technical Picture for the WTI Crude Oil Price
The chart above shows how the price of oil has outperformed in 2021. Even with the recent decline, amplified by poor liquidity given the Thanksgiving holiday in the United States, the annual gain remains impressive.
The technical picture reveals how the price of oil reacted at dynamic resistance. Moreover, on its way down, it failed to break the higher lows series. As such, the bias remains bullish while the price holds above the critical $60 level.
Goldman Sachs Calls the Drop “Excessive Repricing”
In a note to clients, Goldman Sachs considers Friday’s drop in the oil prices as “excessive repricing.” More precisely, the investment house argues that the move was exacerbated due to the low trading activity on Black Friday.
The drop caused OPEC+ to rethink its strategy. In a statement, the group announced that it needed time to reassess the drop in oil prices. Moreover, because oil is a commodity depending on the supply and demand imbalances, OPEC+ wants more proof that the oil demand can be affected. As such, it postponed its meeting.
All in all, while Friday’s drop in price was aggressive, bulls still have a case as long as the WTI crude oil price holds above $60. A drop below puts bears in charge.
This article represents the opinion of the Companies operating under the FXOpen brand only. It is not to be construed as an offer, solicitation, or recommendation with respect to products and services provided by the Companies operating under the FXOpen brand, nor is it to be considered financial advice.
Stay ahead of the market!
Subscribe now to our mailing list and receive the latest market news and insights delivered directly to your inbox.

Latest from Financial Market News
Latest articles

Weekly Market Wrap With Gary Thomson: Nasdaq, EUR/USD, USD/CHF, Brent Crude Oil, Googl Shares
Get the latest scoop on the week's hottest headlines, all in one convenient video. Join Gary Thomson, the COO of FXOpen UK, as he breaks down the most significant news reports and shares his expert insights.
- Nasdaq Composite: Worst Session

Analysis of AUD/USD: Exchange Rate Falls to Early May Low
As indicated by the 4-hour AUD/USD chart today:
→ the rate fell below 0.652, a level last seen on May 2;
→ the RSI indicator dropped below 15, a level last seen during the panic over the spread of COVID-19

Analysis of AMZN Stock: Price at 1.5-Month Low
As shown in the AMZN chart, the stock price dropped below:
→ the psychological level of $180;
→ the mid-June interim low.
The last time AMZN traded below $180 was in early June.
Thus, AMZN has faced sell-offs, similar to other tech