


Japanese Candlestick Cheat Sheet by FXOpen
FXOpen
Japanese candlestick patterns have been a cornerstone of technical analysis for centuries, offering traders valuable insights into price movements and market sentiment. In this comprehensive cheat sheet prepared by FXOpen, we will dive into the world of Japanese candlesticks, shedding light on their components and the essential role they play in interpreting price charts.
Importance of Candlestick Patterns
We won’t explain the basics of Japanese candles, but we will focus on their types, and the key features you may need when trading on a candlestick chart.
Patterns and Market Sentiment
Candlestick patterns are not isolated entities but rather sequences of candlesticks that form recognisable shapes. They visually reveal the evolving sentiment of market participants.
For example, a series of bullish candlesticks forming higher highs and higher lows creates an uptrend pattern, indicating increasing bullish sentiment. Conversely, a sequence of bearish candlesticks with lower highs and lower lows signifies a downtrend, reflecting bearish sentiment.
The length of the body and the wicks provide visual cues about the intensity of price movements. A long body suggests strong buying or selling pressure, while small bodies indicate indecision or consolidation.
Predictive Power
One of the most compelling aspects of Japanese candlestick patterns is their predictive power in anticipating future price movements. These patterns serve as invaluable tools for traders seeking to identify potential reversals, continuations, and moments of indecision in the market. Here's how candlestick patterns demonstrate their predictive capabilities:
Reversal Patterns
- Candlestick reversal patterns, such as an Engulfing Pattern or Hammer, often occur at the end of an existing trend. They visually signify a potential shift in market sentiment. Traders often use these patterns to identify entry and exit points for contrarian positions, aiming to take advantage of a trend reversal.
Continuation Patterns
- Candlestick continuation patterns, such as the Rising/Falling Three Method and the Three Line Strike, provide visual cues that a prevailing trend is likely to continue. Traders use continuation patterns to implement trend-following strategies and trade within the trend.
Indecision Points
- Certain candlestick patterns, like the "Doji" or "Spinning Top," visually indicate market indecision. These patterns suggest that neither bulls nor bears have a clear upper hand during the given time period. Traders recognise indecision points as opportunities to exercise caution, tighten stop-loss orders, or await more convincing signals before making trading decisions.
Candlestick Patterns By Number of Candles
Candlestick chart types can be categorised based on the number of candlesticks involved in each pattern. Although they can consist of as many as seven candles, the more frequent formations include between 1 and 3 candles. Here's a breakdown of some common candlestick chart types by the number of candlesticks:
Single Candlestick Patterns
- Doji: A single candlestick with a small body and long wicks, indicating market indecision.
- Spinning Top: Similar to a Doji but with a slightly larger body, representing uncertainty in the market.
- Hammer: A single candlestick with a small body, a long lower wick, and no upper wick, signalling a potential bullish reversal.
- Shooting Star: The opposite of a Hammer, with a small body, a long upper wick, and no lower wick, suggesting a potential bearish reversal.
Two-Candlestick Patterns
- Bullish Engulfing: A bullish reversal pattern where the second candle (bullish) completely engulfs the previous bearish candle.
- Bearish Engulfing: A bearish reversal pattern where the second candle (bearish) fully engulfs the preceding bullish candle.
- Harami: A two-candlestick pattern where the first candle is larger, followed by a smaller candle that is entirely contained within the first candle. It signals a potential reversal.
- Piercing Line: A bullish reversal pattern where the second candle opens below the first candle's low but closes above its midpoint.
Three-Candlestick Patterns
- Morning Star: A bullish reversal pattern consisting of three candles: a long bearish candle, followed by a small indecision candle, and then a long bullish candle.
- Evening Star: The bearish counterpart of the Morning Star, consisting of three candles: a long bullish candle, a small indecision candle, and then a long bearish candle.
- Three White Soldiers: A bullish reversal pattern formed by three consecutive long bullish candles, potentially indicating a strong uptrend.
- Three Black Crows: The bearish counterpart of the Three White Soldiers, formed by three consecutive long bearish candles, potentially signalling a strong downtrend.
Japanese Candlestick Pattern Cheat Sheet for Quick Reference
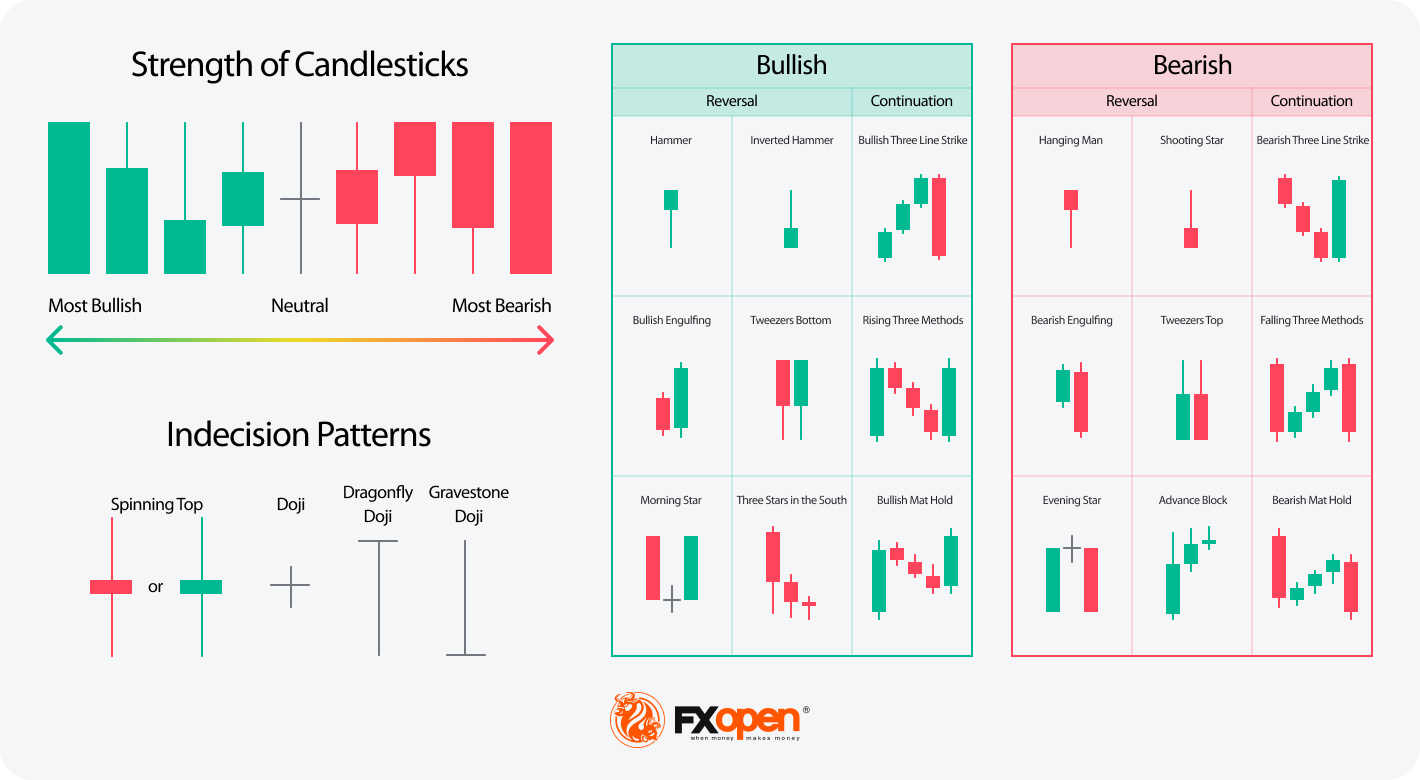
How to Use the Cheat Sheet Effectively
Candlestick patterns are a fascinating and powerful tool in a trader's toolkit, offering insights into market sentiment and potential price movements. However, to leverage these patterns effectively, traders need more than just a forex candlestick cheat sheet; they need the knowledge and skills to interpret and apply them correctly.
Practice and Familiarisation
"Practice makes perfect;" this adage holds true for mastering candlestick patterns. To become proficient in identifying and interpreting these patterns, consider the following:
- Real-World Application: It's crucial to apply what you've learned from the cheat sheet to real-world market scenarios. Open an FXOpen account, use historical price data, or analyse live charts to identify candlestick patterns in action.
- Pattern Recognition Exercises: Engage in pattern recognition exercises regularly. If you feel uncertain about some patterns you can open a demo account and test candlestick signals there. This repetitive practice may enhance your ability to spot patterns quickly.
Confirmation and Context
Candlestick patterns, while powerful, should not be used in isolation. They gain strength when combined with other technical indicators and a broader market context:
- Holistic Analysis: Remember that candlestick patterns are just one part of your analysis. Always consider the broader picture by combining candlestick signals with fundamental factors that may affect the direction of the asset you trade.
- Confirmation Tools: Seek confirmation from additional indicators. For example, if you identify a bullish reversal pattern, ensure that it aligns with bullish signals from other technical tools, including support levels, technical indicators, or chart patterns. The more confirmations, the stronger the setup.
- Multiple Timeframes: Analyse multiple timeframes to gain a more comprehensive overview. A candlestick pattern on a daily chart might carry more weight if it aligns with patterns on shorter timeframes. This may help you make more informed decisions.
Risk Management
Trading involves risks, and proper risk management is crucial, especially when making decisions based on candlestick patterns:
- Clear Stop-Loss Orders: You may want to implement strict risk management by setting clear stop-loss orders for your trades. You can determine your maximum acceptable loss for each trade and stick to it.
- Position Sizing: You may apply a rule of not risking more than a predetermined percentage of your trading capital on a single trade. Position sizing potentially ensures that no single trade can wipe out your account.
- Risk-Reward Ratio: Evaluate the risk-reward ratio for every trade to ensure that the potential return is commensurate with the risk involved.
- Market Conditions Adoption: Be flexible in your risk management strategies. Market conditions can change, and you may need to adjust your risk parameters accordingly, especially during periods of high volatility.
Takeaway
It's important to remember that the effectiveness of candlestick patterns lies not only in recognition but also in interpretation and application. While our cheat sheet provides a quick reference, it's your diligence, practice, and consideration of confirmation and risk management that truly harnesses the power of these patterns. If you want to practise, head over to the TickTrader trading platform.
This article represents the opinion of the Companies operating under the FXOpen brand only. It is not to be construed as an offer, solicitation, or recommendation with respect to products and services provided by the Companies operating under the FXOpen brand, nor is it to be considered financial advice.
Stay ahead of the market!
Subscribe now to our mailing list and receive the latest market news and insights delivered directly to your inbox.


Latest articles

AI Valuations Are Back in the Spotlight
Artificial intelligence remains the dominant investment theme of 2026, but investors are increasingly questioning whether AI stock valuations are keeping pace with reality.
💰 Big Tech continues to invest at an unprecedented scale, with hyperscaler AI spending projected to exceed $800

AUD/CAD: Months of Indecision — Is a Breakout Finally Coming?
The Australian dollar has clawed back most of its end-of-June losses, when it touched three-month lows against the greenback amid escalating Middle East tensions. Since then, sentiment has improved: the RBA's Assistant Governor Sarah Hunter signalled the board stands ready

USD/JPY: Battling at the Top of the Triangle
On 3 July, Japan's Finance Minister, Satsuki Katayama, stated that the Ministry of Finance remains in close contact with US authorities regarding developments in USD/JPY as the yen traded near its weakest level in almost 40 years. Similar verbal