


Jarroo Strategy: Price Action Approach
FXOpen

When diving into the world of the best price action methods, the Jarroo Method stands out. This trading method utilises a unique approach to reading market sentiment through key levels of support and resistance. In this article, we’ll break down the Jarroo Method step-by-step.
The Basics of Price Action-Based Trading Strategies
Price action is a methodology that relies solely on the analysis of price movements, foregoing the use of traditional indicators. Traders employing a price action trading strategy focus on raw chart data to interpret market sentiment and make decisions. While some might seek the best indicator for price action, it's essential to understand that the nature of price action analysis is such that there are no universally best indicators; it hinges on the trader's skill in interpreting pure price data.
Key Levels: Identifying Support and Resistance
In the Method Jarroo, recognising key levels of support and resistance is crucial. Supports refer to horizontal lines drawn through price points where the asset has historically had difficulty falling below. Conversely, resistances are lines set at price points that the asset rarely exceeds.
Traders often identify these levels by locating prominent local highs and lows in the asset's price history. Ideally, at least two candlesticks should close or open at the same or nearly the same point to affirm their significance. The aim is to gain insights into potential future price movements, as prices frequently bounce between support and resistance.
To follow along with the strategy below, head over to FXOpen’s free TickTrader platform. There, you’ll find hundreds of assets to test the Jarroo Method.
Going Long with Method Jarroo
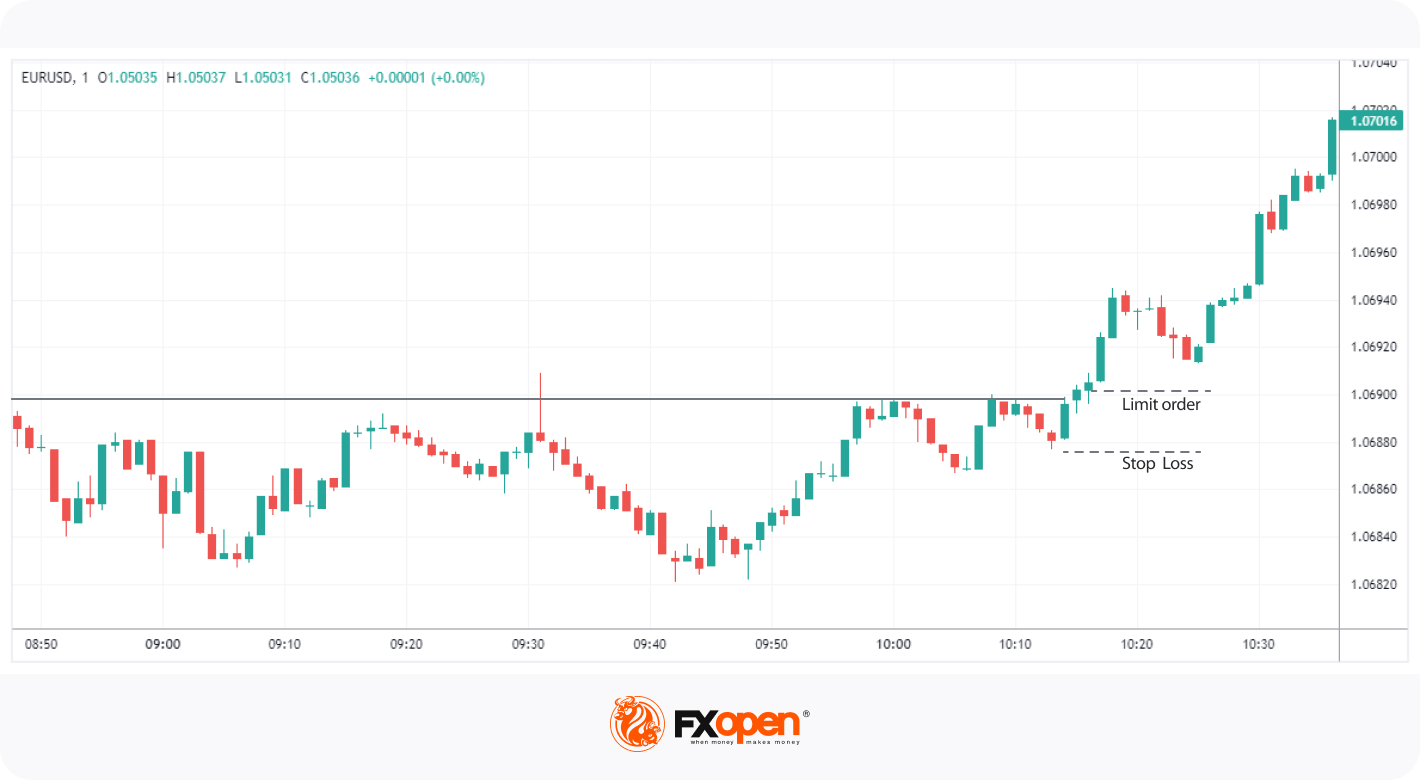
In a long strategy using Method Jarroo, traders typically look for instances where the asset price breaches a resistance level and then closes above it. This event often signals an upward trend.
Entry
Traders may consider placing a buy limit order above resistance.
Stop Loss
Stop-loss orders may be set just below the low of the breakout candle or slightly below the resistance itself, offering a safety net against unfavourable movements.
Take Profit
For realising gains, traders often set their take-profit orders near the next level of resistance, ensuring the take profit is at least 2 or 3 times the size of the stop loss.
Going Short with Method Jarroo
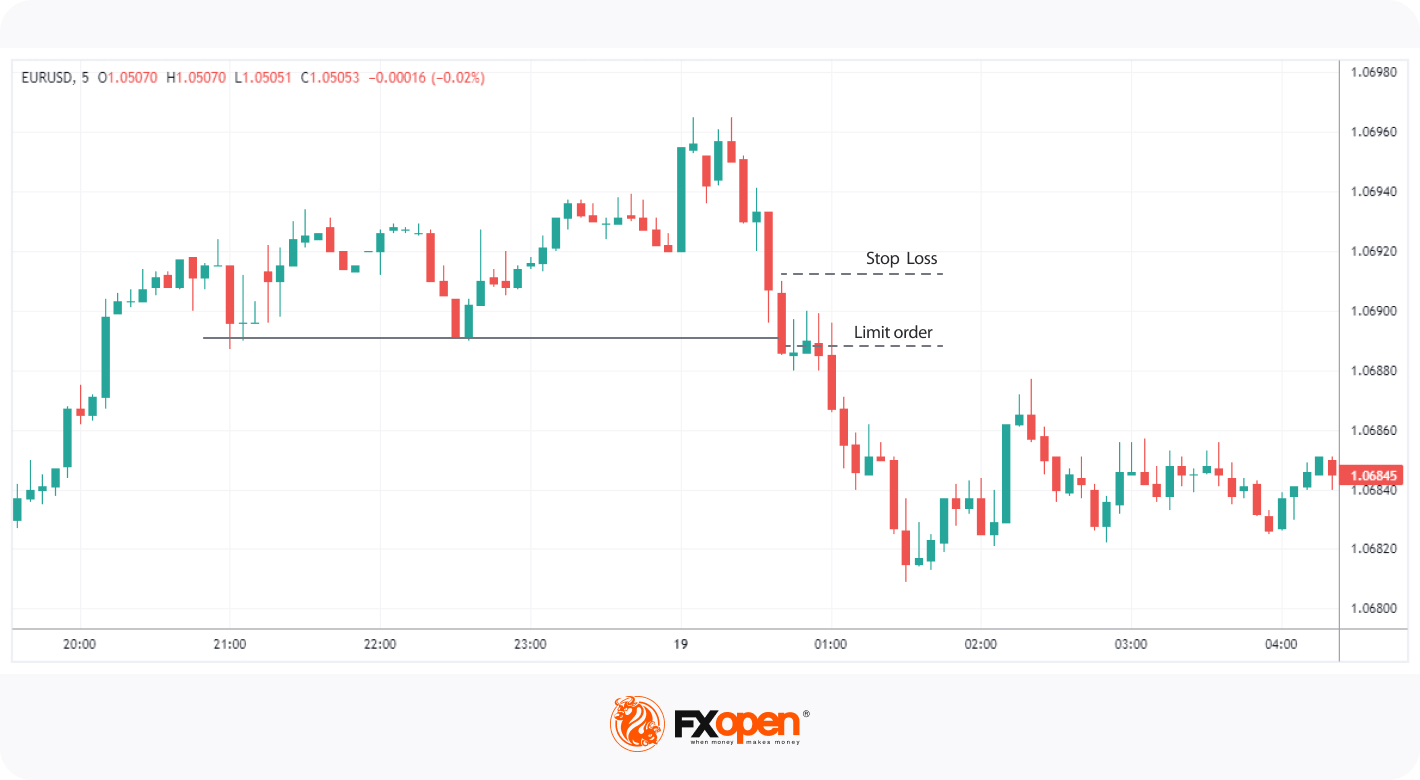
In trading price action, the best strategies provide guidelines for both going long and going short. When it comes to Method Jarroo, the short strategy comes into play when an asset price breaks below a support level and closes under it.
Entry
Traders often consider placing a sell limit order below a support point.
Stop Loss
A stop loss may be established just above the high of the breakout candle or a bit above the support itself.
Take Profit
Traders may target the nearest lower support point for realising gains, ensuring the take profit is 2 or 3 times larger than the stop loss.
Risk Management in Method Jarroo
In employing the Method Jarroo approach, risk management remains crucial. Position sizing is typically kept within 1-2% of the trading account to mitigate significant losses. Some traders opt for additional confirmation candles after a breakout, ensuring the asset's price sustains its new level before entering a market.
The Bottom Line
In summary, the Method Jarroo offers a versatile approach to trading, balancing risk and reward effectively. Its focus on key levels and pure price data makes it a noteworthy addition to any trader's toolbox. To take full advantage of this method, practise and modify it in accordance with your trading approach, consider opening an FXOpen account. When you do, you’ll gain access to hundreds of markets to trade, lightning-fast execution speeds, and competitive trading costs – essential points for trading the Method Jaroo. Happy trading!
This article represents the opinion of the Companies operating under the FXOpen brand only. It is not to be construed as an offer, solicitation, or recommendation with respect to products and services provided by the Companies operating under the FXOpen brand, nor is it to be considered financial advice.
Stay ahead of the market!
Subscribe now to our mailing list and receive the latest market news and insights delivered directly to your inbox.


Latest articles

Weekly Market Insights with Gary Thomson: The Week of Central Banks and Earnings
In this video, we’ll explore the key economic events and market trends, shaping the financial landscape. Get ready for insights into financial markets to help you navigate the week ahead. Let’s dive in!
In this episode of Market

Intel at a Crossroads: Earnings Beat Meets Technical Resistance
Intel has just delivered its strongest quarter in over fifteen years, and the market reaction says it all. Q2 2026 revenue surged 25% year-over-year to $16.1 billion, crushing the consensus estimate of $14.42 billion, while adjusted EPS of

Tesla: Complex Range Structure Breaks Down Following Quarterly Earnings
Tesla released its Q2 2026 results after the market closed on 22 July. Revenue increased 26% year-on-year to $28.24 billion, while vehicle deliveries reached a record 480,126 units. However, operating margin fell sharply to 1.4%, down from