FXOpen

The Japanese yen (JPY) has been on the move lately, and the velocity of its depreciation is something not seen since 2014. In addition, the news broke out today that the Bank of Japan (BOJ) intends to conduct unlimited fixed-rate purchase operations for the 10-year JGBS (Japanese government bonds), a move that is part of the yield curve control measures adopted by the BOJ.
The news triggered a sharp rally in the JPY pairs, with the USD/JPY rising more than 300 pips since today's opening levels. So why are investors selling the JPY?
In a world where central banks are tightening their monetary policies, the BOJ is doing the opposite. For example, the Bank of England has already raised its rate to 0.75%. Moreover, the Fed in the United States delivered its first rate hike and is forecast to raise rates at every meeting. Furthermore, some are talking about a 50bp rate hike at the next meeting. Even the ECB, which has been putting the deposit facility rate into negative territory for several years now, signaled that it is time to normalize the policy.
But BOJ thinks differently, fueling the JPY's decline.

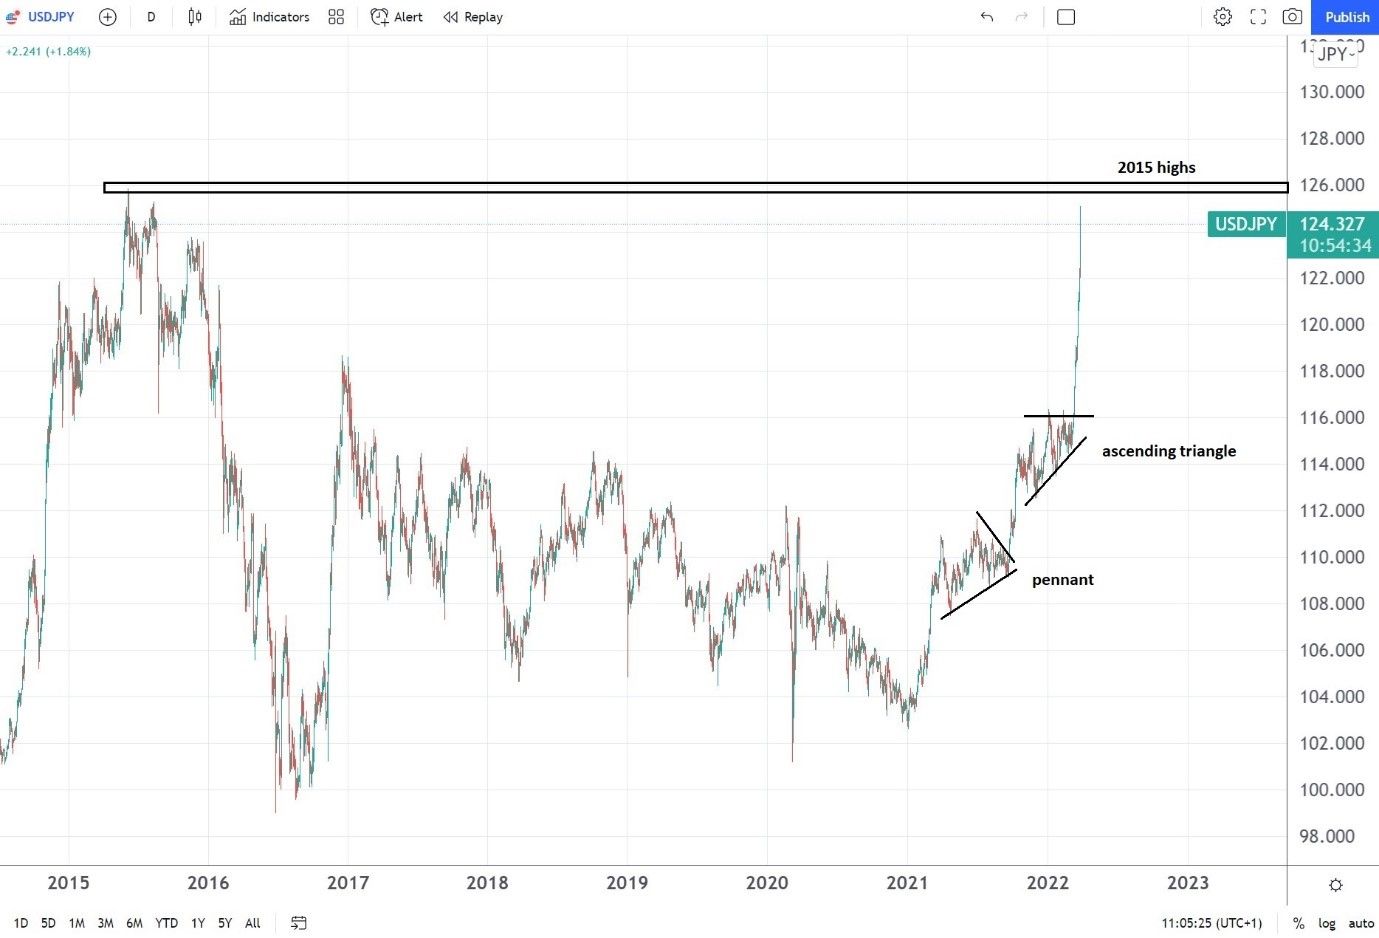
USD/JPY Close To 2015 Highs
While the rise in the USD/JPY pair is nothing short of impressive, it did not start today. A quick look at the daily chart reveals that the bullish trend originated in 2021, and the market did not look back anymore.
It consolidated in two continuation patterns – one pennant and one ascending triangle - pointing to higher levels to come. At this point, the pair is trading close to its 7-year high, and judging by the pace of the move, we should not be surprised to see further stops being triggered.
All in all, the JPY pairs' rally will likely continue as the BOJ's monetary policy diverges from the rest of the world. Unless something changes, investors will probably keep selling the yen.
This article represents the opinion of the Companies operating under the FXOpen brand only. It is not to be construed as an offer, solicitation, or recommendation with respect to products and services provided by the Companies operating under the FXOpen brand, nor is it to be considered financial advice.
Stay ahead of the market!
Subscribe now to our mailing list and receive the latest market news and insights delivered directly to your inbox.


