LTC and EOS - Breakout expected
LTC/USD
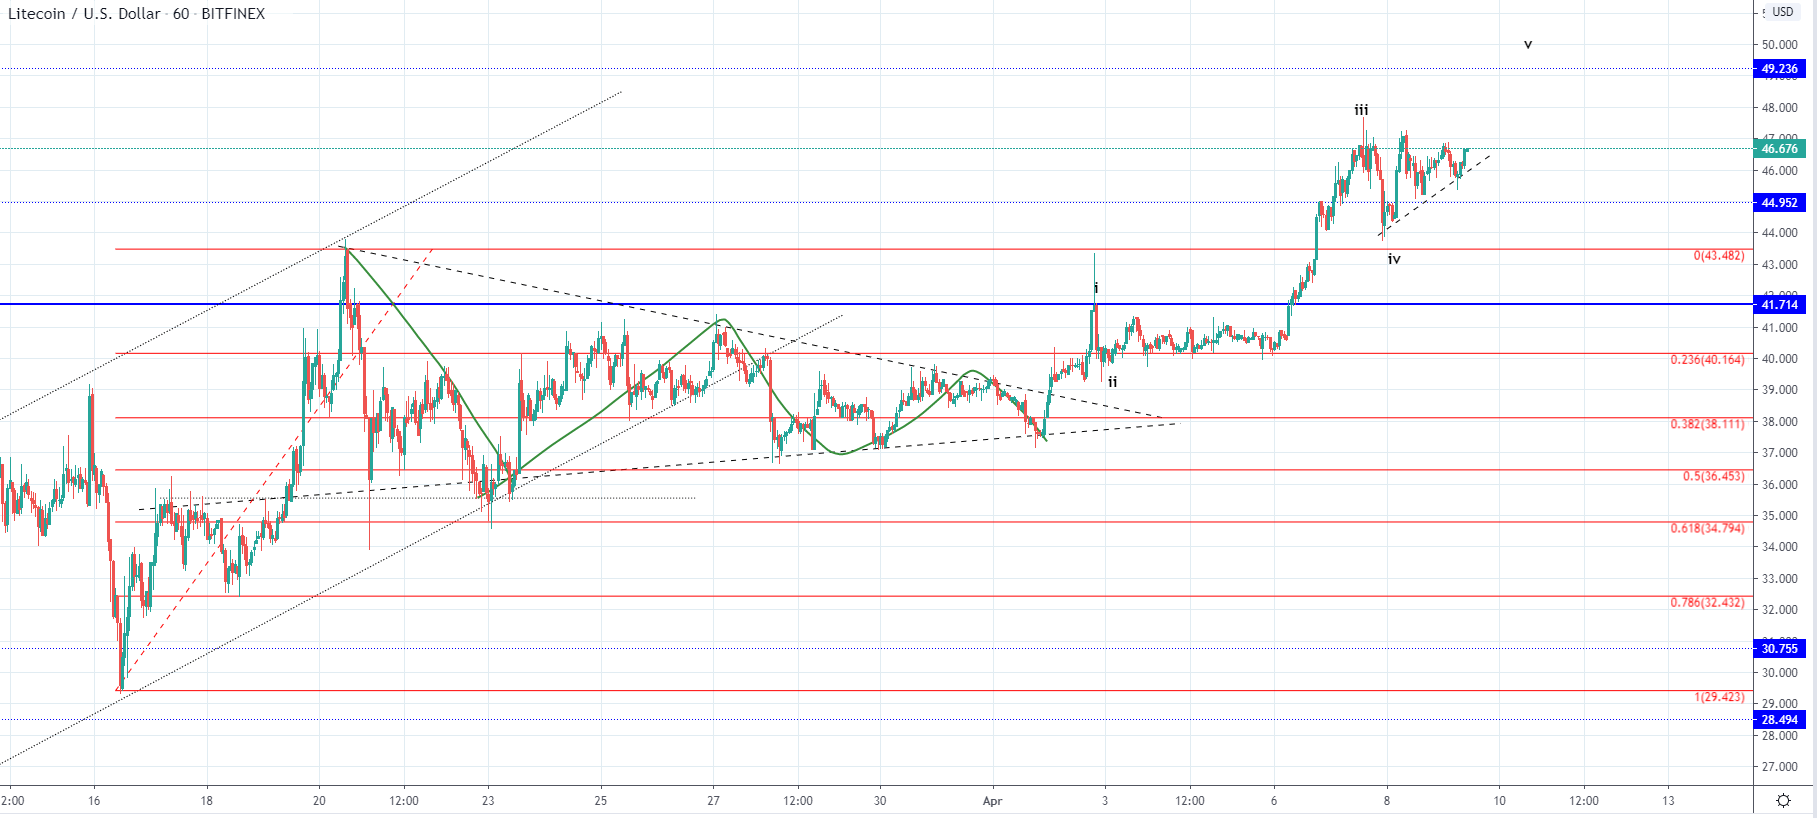
Since Monday’s open at $40.22 the price of Litecoin has been increasing and reached it’s highest point on the next day which was at $47.22 and is an increase of 17.51%. Yesterday after a minor retracement the price came back to retest the weekly high and found resistance there but is now again being traded around those levels.
If the price continues increasing and manages to breakout above the Tuesday’s high further increase would be expected in a spiky manner as the buyers chasing would push the price. But if the price encounters strong resistance after the current interaction it could bring the price in a straight downfall to the $41.7 horizontal level.
It all depends on whether or not we have seen the completion of the 5th wave from the impulsive move on Tuesday or are we to see one more wave to the upside.
EOS/USD
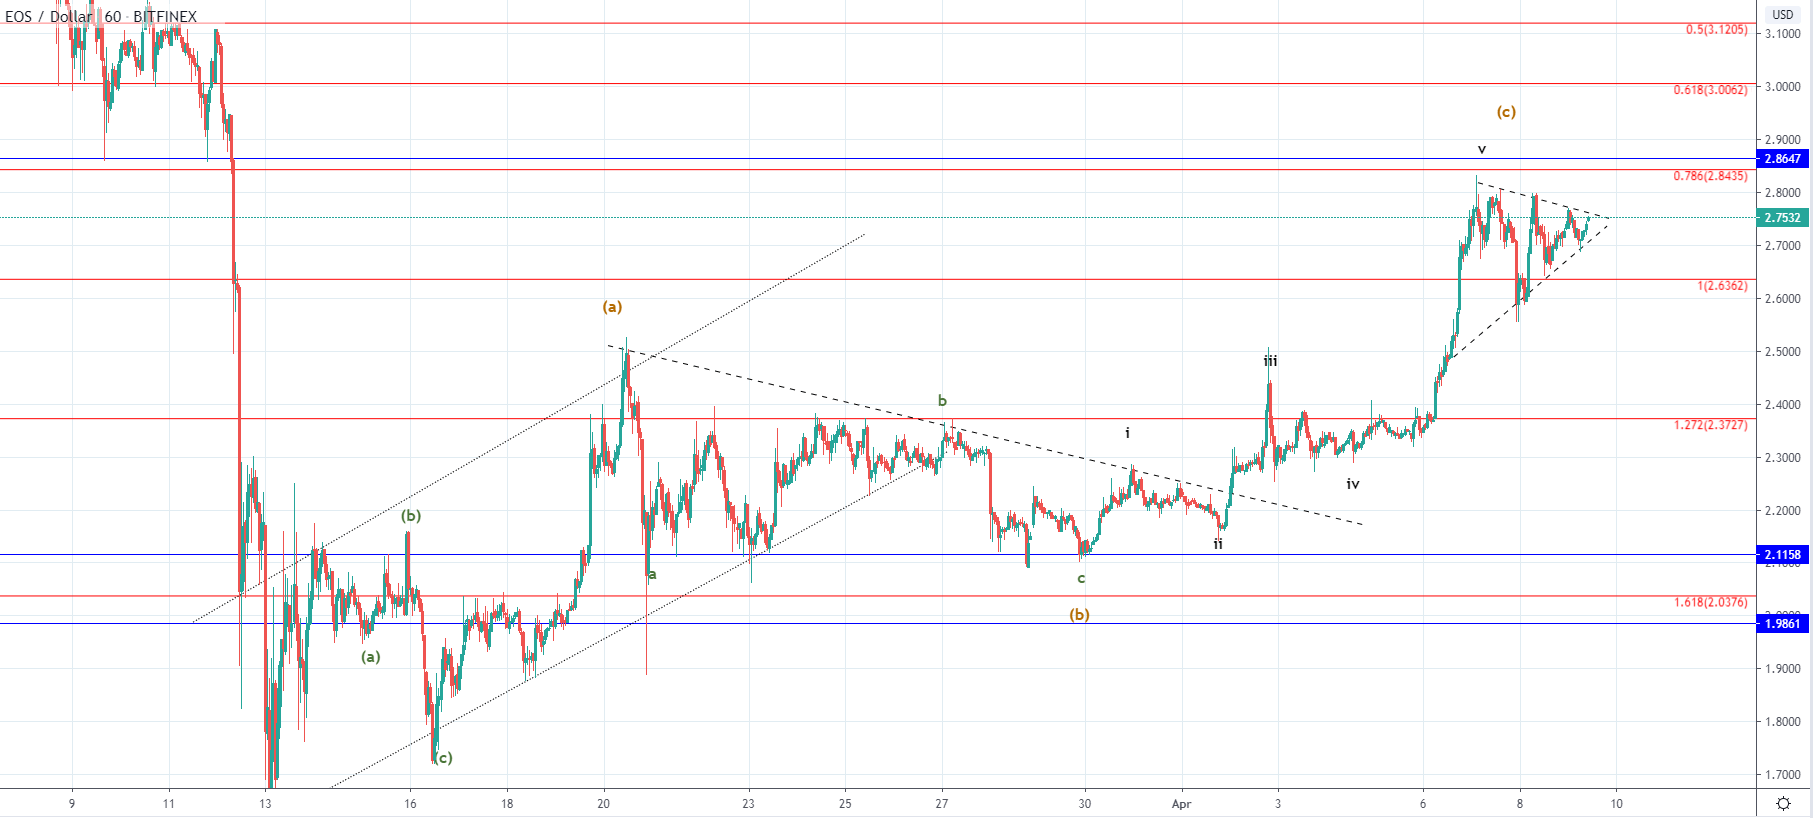
The price of EOS has increased by 19.43% coming from it’s open on Monday at $2.344 to $2.8 made on Tuesday. Like in the case of Litecoin the price action started forming an ascending triangle as it’s support level is steeper then it’s resistance one.
Looking at the hourly chart of EOS you can see that it outlines another possibility which was presented in the case of Litecoin, namely that the 5th wave out of the current impulse wave ended. Instead of the previous descending triangle forming a five-wave correction it made a three-wave one which is why the increase from the 30th of March and it’s first higher low could be the first two waves out of the five-wave impulse.
This will shortly be validated by the breakout direction from the ascending triangle but in either way, after it’s completion I would be expecting another corrective downward sequence. If the increase from mid-March until today was an ABC to the upside the descending move which is to follow could develop in another downtrend resulting in lower lows then in March.