


LTC and EOS - Has The Correction Ended?
FXOpen

LTC/USD
From Monday’s high at $47.53 the price of Litecoin has decreased by 9.73% as it came down to $42.916 at its lowest point today. Today’s low was the second retest of the level on which the price found support on Monday and from where recovery was seen to the $45.26 area. But as resistance was present at those levels another descending move was seen.
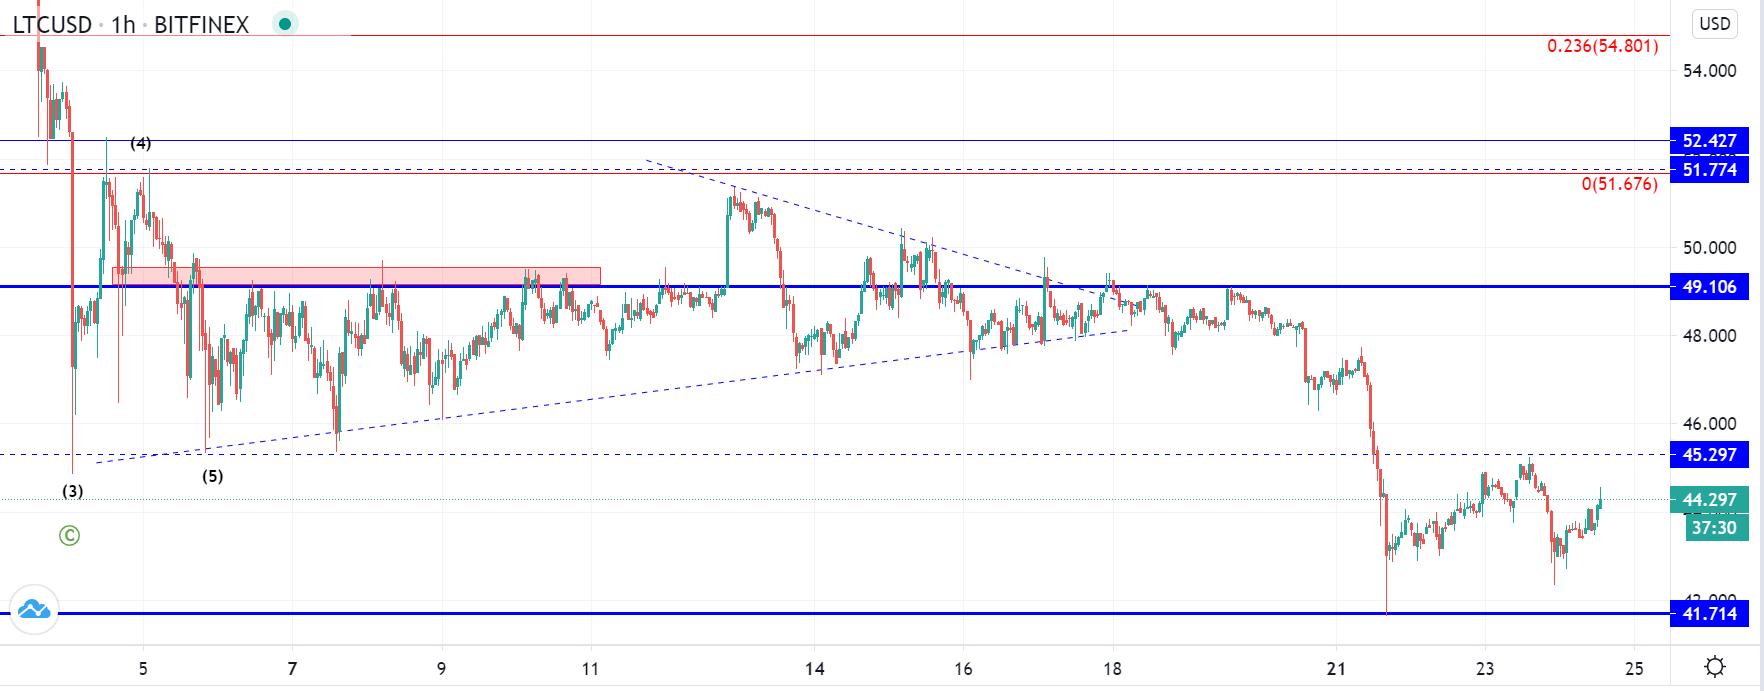
The price of Litecoin found support there once again and has been increasing since but is still struggling to keep up the upward momentum and form a higher high. As the price broke out to the downside below the $45.3 area where the upper range found support, a test of the lower significant horizontal level was made but only on a quick spike as the price snapped back above the $43 level on the hourly chart.
This is why another decrease could be seen either as a retest of the $41.7 significant level or a straight pierce through the level on the next descending move. This would be a downtrend continuation from the previous breakout momentum that was made as an interaction with the $49.1 level ended as a rejection and the price going below the support of the symmetrical triangle.
If the price continues moving to the downside from the current level a breakout below $41 area would be expected, but if the price founds support there it could indicate that the descending movement is over.
EOS/USD
The price of EOS has been increasing from yesterday and came up by 4.8% from $2.3951 to just slightly below $2.5. This minor bullish momentum has pushed the price back to retest the horizontal level from which it broke out to the downside yesterday. Now we are to see if the price finds resistance there or will it go back above it into the upper range.
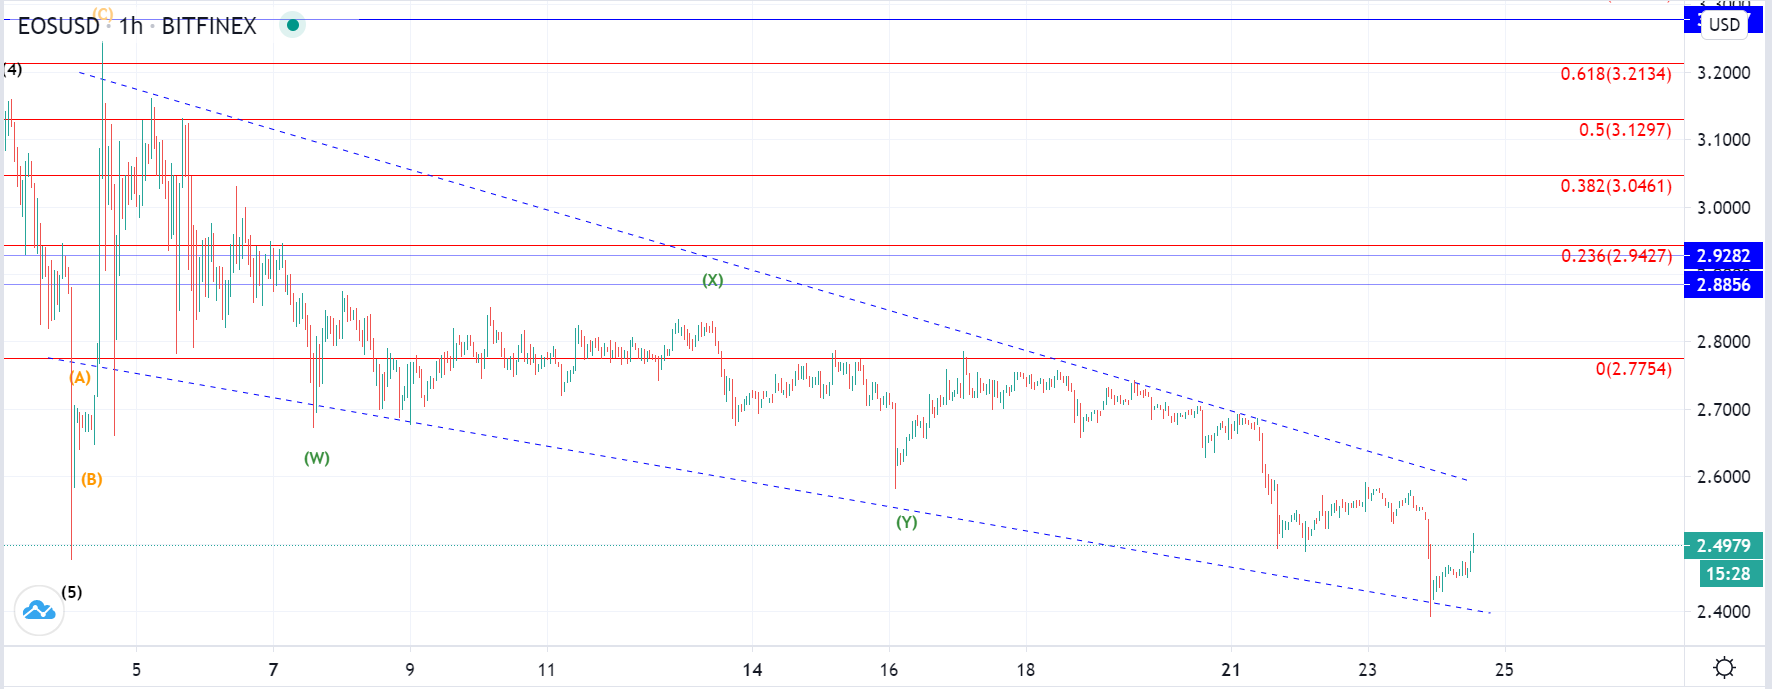
If the price of EOS continues moving to the upside and enters the upper range it will likely continue increasing and potentially breakout from the upper since on the descending triangle. But if the price finds resistance at the current levels and continues moving to the downside again another downturn could be expected with the price breaking the descending triangles support.
Considering that the price has been in a corrective descending structure from the 5th of September we are just short of the completion of the corrective move. This is why we could have seen its completion on yesterday’s low but validation is first needed.
FXOpen offers the world's most popular cryptocurrency CFDs*, including Bitcoin and Ethereum. Floating spreads, 1:2 leverage — at your service (additional fees may apply). Open your trading account now or learn more about crypto CFD trading with FXOpen.
*Important: At FXOpen UK, Cryptocurrency trading via CFDs is only available to our Professional clients. They are not available for trading by Retail clients. To find out more information about how this may affect you, please get in touch with our team.
This article represents the opinion of the Companies operating under the FXOpen brand only. It is not to be construed as an offer, solicitation, or recommendation with respect to products and services provided by the Companies operating under the FXOpen brand, nor is it to be considered financial advice.
Stay ahead of the market!
Subscribe now to our mailing list and receive the latest market news and insights delivered directly to your inbox.


Latest articles

EUR/USD Eyes Gains As USD/CHF Weakness Deepens Again
EUR/USD started a fresh increase above 1.1700 and 1.1720. USD/CHF declined further and is now struggling below 0.7835.
Important Takeaways for EUR/USD and USD/CHF Analysis Today
· The Euro started a decent increase from

Apple: Earnings Day Above the Activity Zone
On 30 April, after the market close, Apple Inc. will release its financial results for the second quarter of fiscal 2026. The consensus forecast, based on estimates from 31 analysts, points to revenue of around $109.7 billion, with expected

USD/JPY and USD/CHF Near Key Levels: The Dollar Supported by the Fed
The US dollar continues to trend upwards following the Federal Reserve meeting, drawing support from the regulator’s moderately hawkish stance and comments by Jerome Powell. Markets interpret the Fed’s rhetoric as a signal that restrictive policy is likely