LTC/USD and EOS/USD downside expected
LTC/USD technical analysis
Since the beginning of the year, the price of Litecoin has been in an upward trajectory increasing exponentially from $30.7. LTC/USD reached $34.970 at it’s highest point yesterday, thus, the growth was around 14%. On Thursday, the altcoin price has decreased from $34.38 to the current level of $33.56. Measuring from January, 1 to the current levels, the pair is still up by 9.22%. But we may see further downside as a minor retracement for Litecoin in the upcoming period.
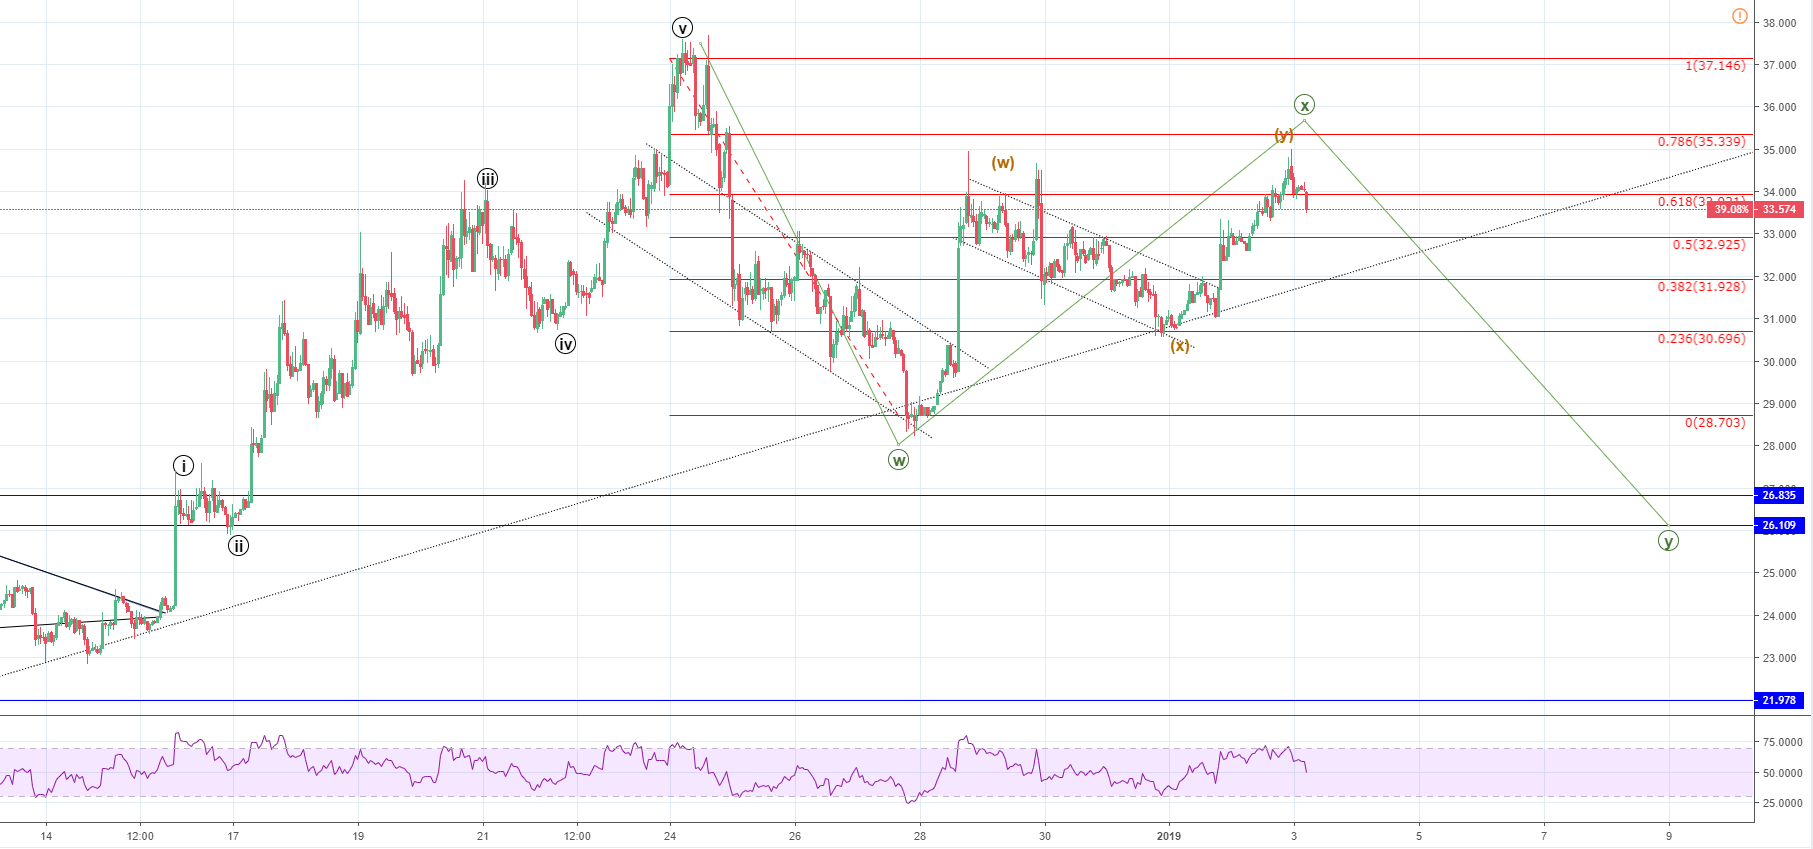
On the hourly chart, after an impulsive 12345 led the price of Litecoin up to $37.146 a correction occurred pushing the price down to $28.7. I have labeled this move as the W wave from the Minute WXY correction which is likely playing out after the impulsive move up. After the W wave was completed and the price action formed a descending channel, a breakout from the upside occurred. This pattern occurred next time as well but on a minor scale. And both times a descending channel was formed making the price escape from the upside.
Now as the LTC/USD price failed to break the previous high and large wicks appeared from the upside indicating sellers’ pressure, we are seeing the end of the Minuette WXY correction which would also be the end of the Minute X wave. RSI also signaled that the price was reaching overbought conditions as it was at 71.29% when the price spiked up to $34.970.
The Minuette correction might get prolonged by two more waves. In this case, the second wave X is expected to land on the minor uptrend support line and the Z wave may potentially go up to the 0.786 Fibonacci level for proper interaction. But as the final waves end on the upper side, more downside is expected. The price action and the RSI confirms that the price has entered the sellers’ territory, so I wouldn’t expect two more waves.
Depending on the hight of the X wave from the Minute WXY, we are going to set and adjust the target for the Y wave. But if the X wave ends on the vicinity of the 0.786 Fibonacci level, the price target would be at around $26.
EOS/USD technical analysis
At the beginning of 2019, the price of the EOS cryptocurrency was $2.6. From there the altcoin has experienced an increase of 14.95% up to $2.9853 which was the highest point yesterday. But as the price encountered some resistance it is now heading downward. The EOS/USD is currently sitting above the horizontal resistance line. But just like the price went above this level last time and quickly fell below it, we are now seeing this repeating but on a smaller scale and much faster.
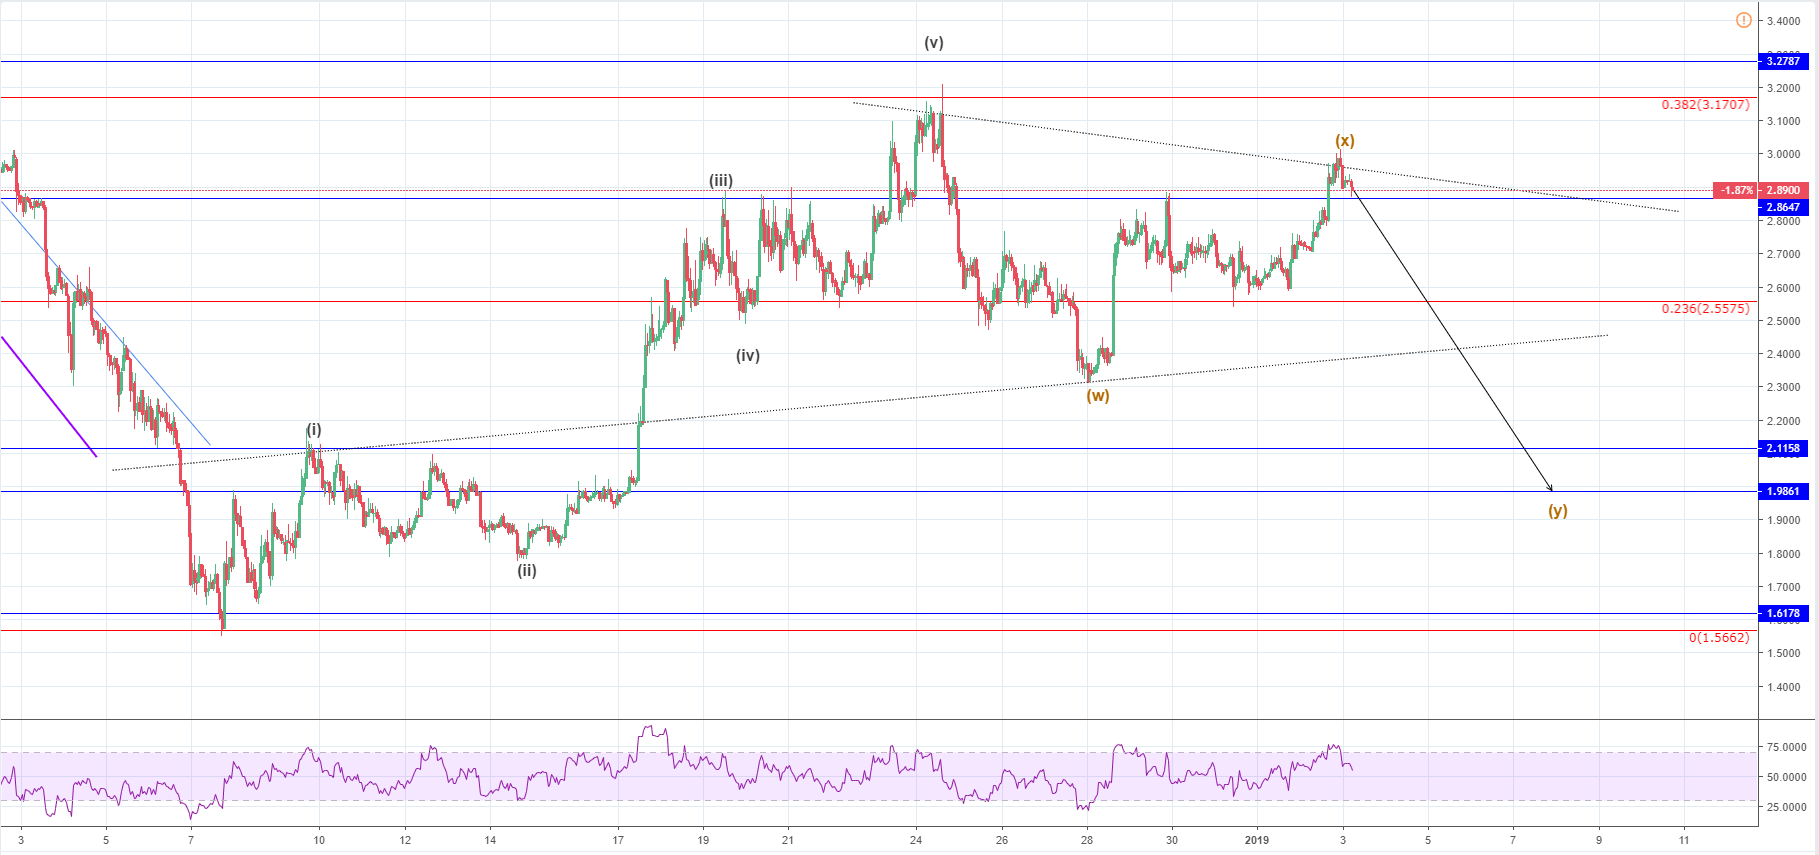
On the hourly chart, a situation is similar to Litecoin as the market is strongly correlated as well as the price action. After an impulsive move, we are now likely to see a correction labeled as a WXY. The current upward move that has likely ended is the X wave from that correction. That means that from here more downside is expected for EOS, but the price target remains unclear with so many possibilities.
I would at least expect that the price goes back to the minor uptrend support line which might serve as the support line in a symmetrical triangle of some kind. But this remains unconfirmed for now as the price action still has to confirm the pattern. That would lead the price of EOS coin to around $2.4. But if my Elliott Wave count is correct, the most optimal target would be at around the horizontal support at $2.115.
Projecting the length of the W wave from the X wave the line ends around the vicinity of the $2.115 horizontal support that we are yet to see.