


LTC/USD and EOS/USD more downside expected
FXOpen
LTC/USD
The price of Litecoin has fallen by 16.34% from yesterday’s high at $51.38 and is currently being traded at $42.8.
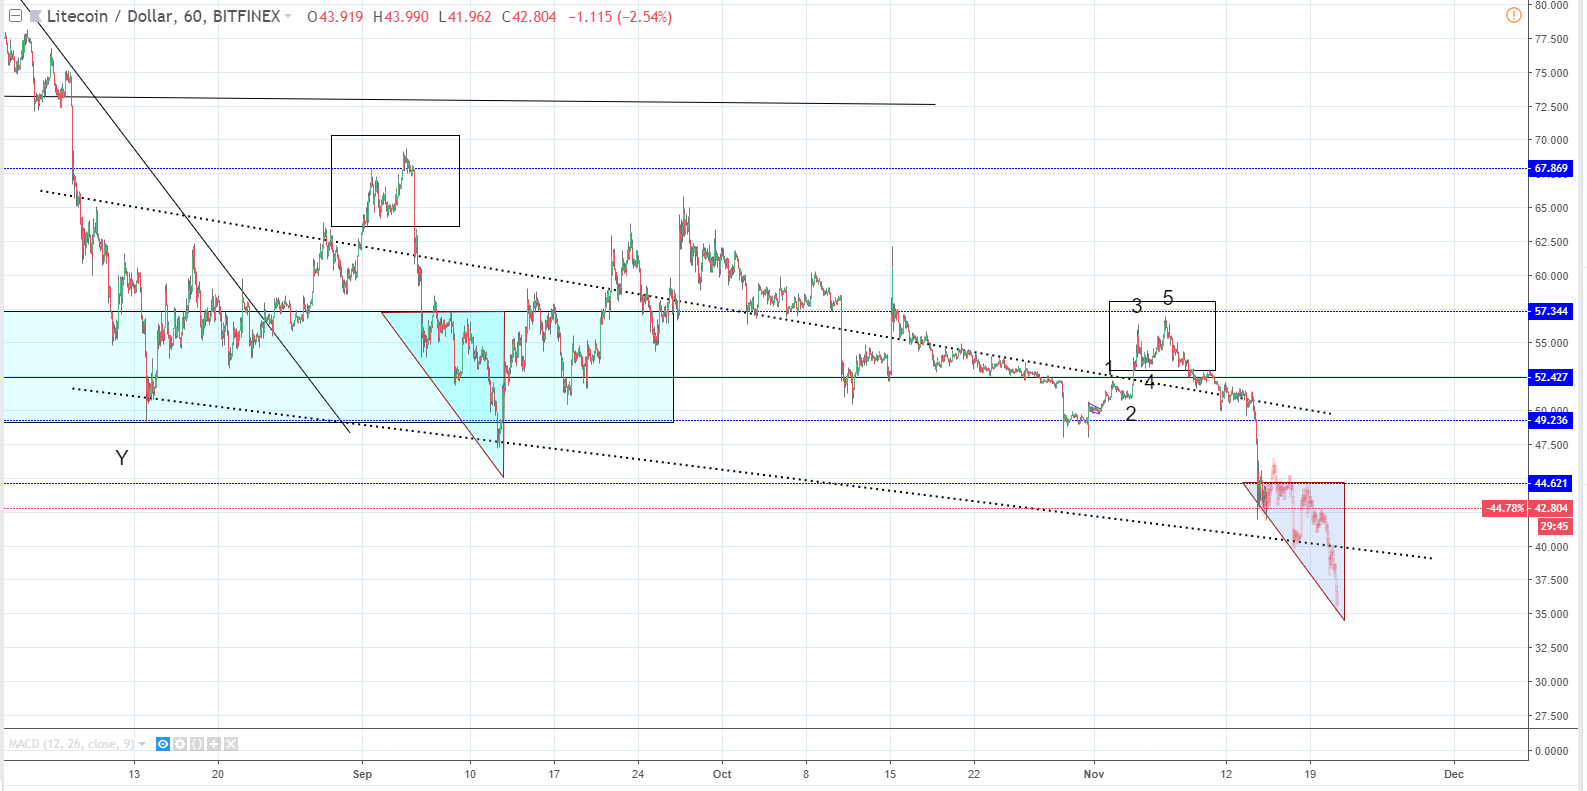
Looking at the hourly chart, we can see that the price fell through the descending channels resistance with a massive momentum as the majority of the decline happened in only 8 hours. Currently, the price is below the S2 support line at $44.621. I’ve labeled as a support zone forming a cluster around those levels. The wicks from the downside are indicating that some support has been found but I believe that it will hold only temporary.
As you can see, I have labeled some fractals. One being the top formation is labeled with a rectangle, and the other one is my project scenario based on the prior scenario. As I am expecting that the price falls further, at least to the descending channel’s support line, this projection looks very likely. Last time when the price behaved like this, we saw more downfall but with more consolidations in between. I believe the same will happen now as well.
Zooming out on to the daily chart, you can see that the projected ghost bar pattern lands on the next significant horizontal support level at $38.21.
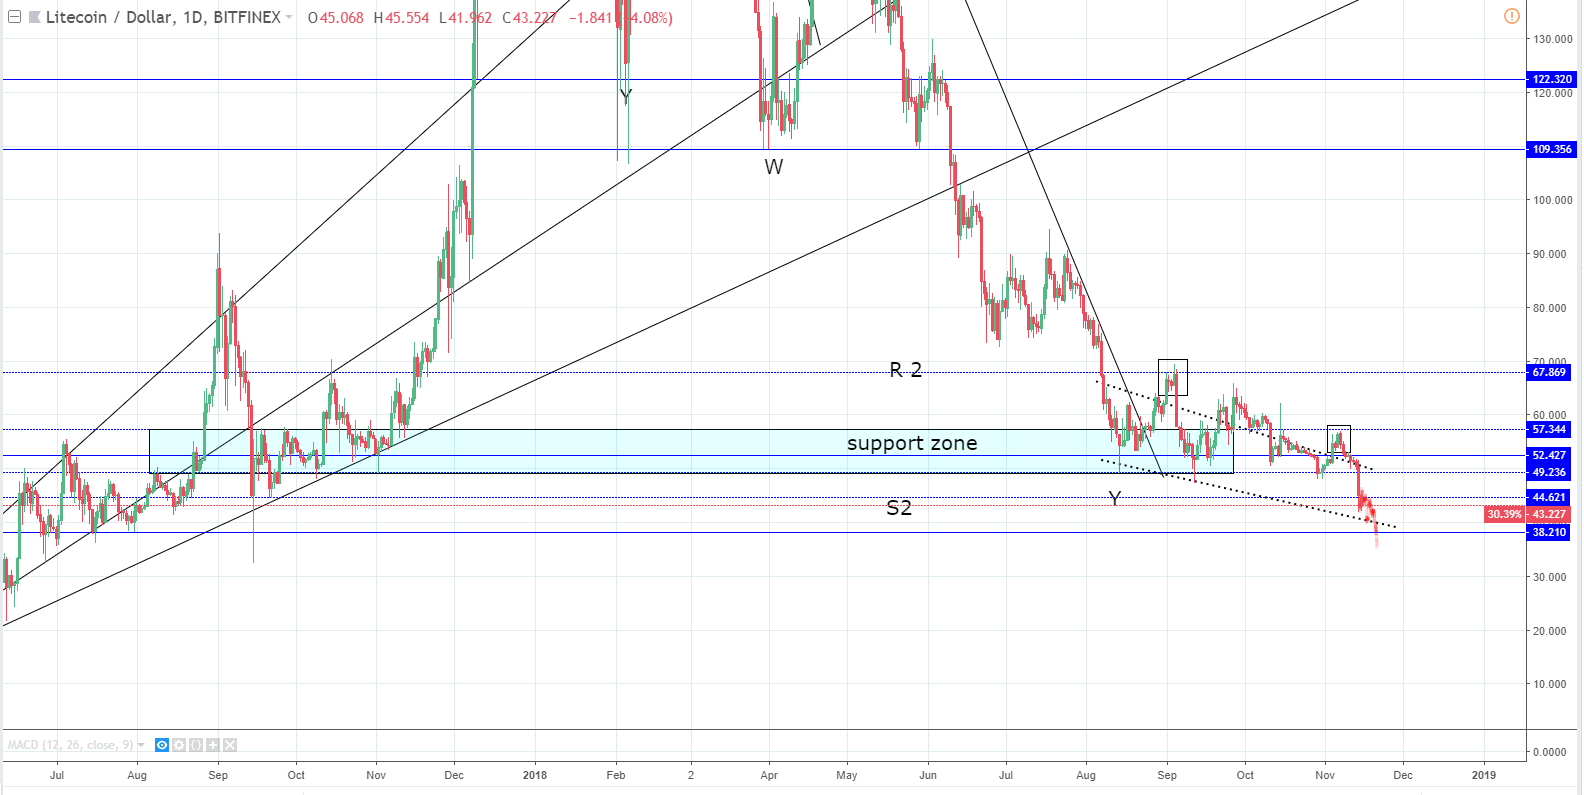
As the price is below S2 and has managed to stay there for some time, we can say that a breakout from the support zone occurred. As you can see prior to this downfall, the price managed to stay above the median line of the support zone for the most part. Now, when the price is below its last accountable reaching level and considering the powerful momentum behind the move, I think that it’s very likely that the price may fall to $38.21 level where it will find support.
EOS/USD
The price of EOS has fallen by 14.89% from yesterday’s high at $5.348 and is currently being traded at $4.5412.

Looking at the hourly chart, we can see that the price has fallen as the minor WXYXZ ended on the significant horizontal level at $5.84, which served as resistance to the next horizontal level, which serves as support at $4.589. Now, when the price has fallen steeply and aggressively we are likely going to see some consolidation around the support level as the price has already fallen below. It was previously forming a cluster putting pressure on the level.
Zooming out to the daily chart, you can see my Elliott Wave labelings. They point out that the price is heading down much further. This symmetrical triangle seen on the hourly chart was only a bearish pennant in which the correction in the opposite direction occurred. The price has broken out from that structure now and started another potentially impulsive move to the downside.
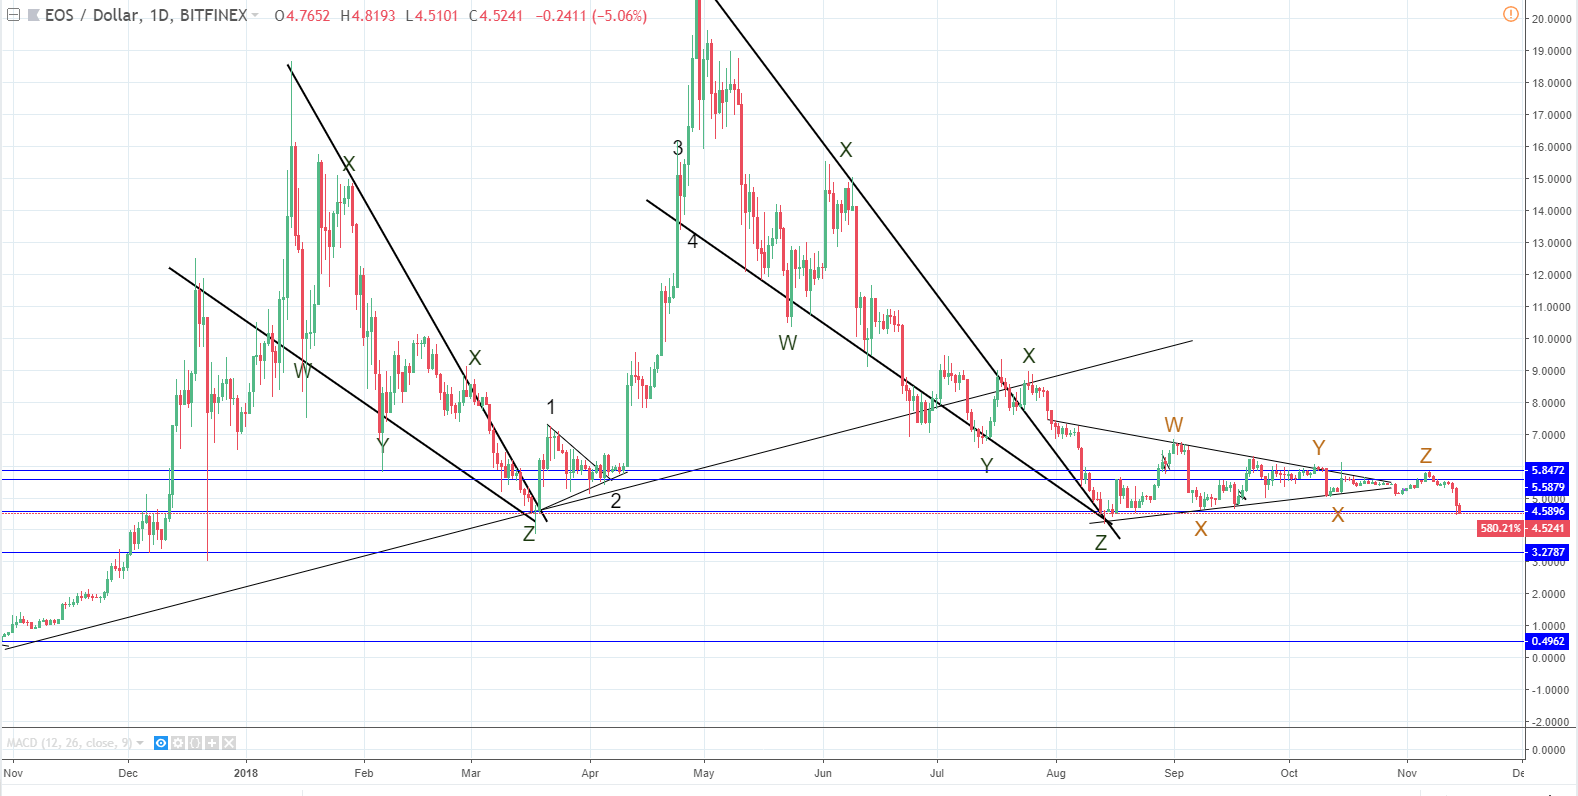
If the EOS/USD pair breaks the current support level (and the price has already been below it on the last Z wave and is currently below it), the next strong enough horizontal support level is at 3.27$.
FXOpen offers the world's most popular cryptocurrency CFDs*, including Bitcoin and Ethereum. Floating spreads, 1:2 leverage — at your service (additional fees may apply). Open your trading account now or learn more about crypto CFD trading with FXOpen.
*Important: At FXOpen UK, Cryptocurrency trading via CFDs is only available to our Professional clients. They are not available for trading by Retail clients. To find out more information about how this may affect you, please get in touch with our team.
This article represents the opinion of the Companies operating under the FXOpen brand only. It is not to be construed as an offer, solicitation, or recommendation with respect to products and services provided by the Companies operating under the FXOpen brand, nor is it to be considered financial advice.
Stay ahead of the market!
Subscribe now to our mailing list and receive the latest market news and insights delivered directly to your inbox.


Latest articles

EUR/USD Eyes Gains As USD/CHF Weakness Deepens Again
EUR/USD started a fresh increase above 1.1700 and 1.1720. USD/CHF declined further and is now struggling below 0.7835.
Important Takeaways for EUR/USD and USD/CHF Analysis Today
· The Euro started a decent increase from

Apple: Earnings Day Above the Activity Zone
On 30 April, after the market close, Apple Inc. will release its financial results for the second quarter of fiscal 2026. The consensus forecast, based on estimates from 31 analysts, points to revenue of around $109.7 billion, with expected

USD/JPY and USD/CHF Near Key Levels: The Dollar Supported by the Fed
The US dollar continues to trend upwards following the Federal Reserve meeting, drawing support from the regulator’s moderately hawkish stance and comments by Jerome Powell. Markets interpret the Fed’s rhetoric as a signal that restrictive policy is likely