LTC/USD and EOS/USD - one more low ahead!
LTC/USD
Since 6th of November, the price of Litecoin has been in a downtrend and on last Thursday the price was $45.385 at the open. From there the price stagnated at first but at the start of this week on Monday the price started to decrease again falling further down to $32.813, which is the yearly low.
The price has been consolidating and is now at around $34.64, which is an overall decrease of 23.40% in the last seven days.
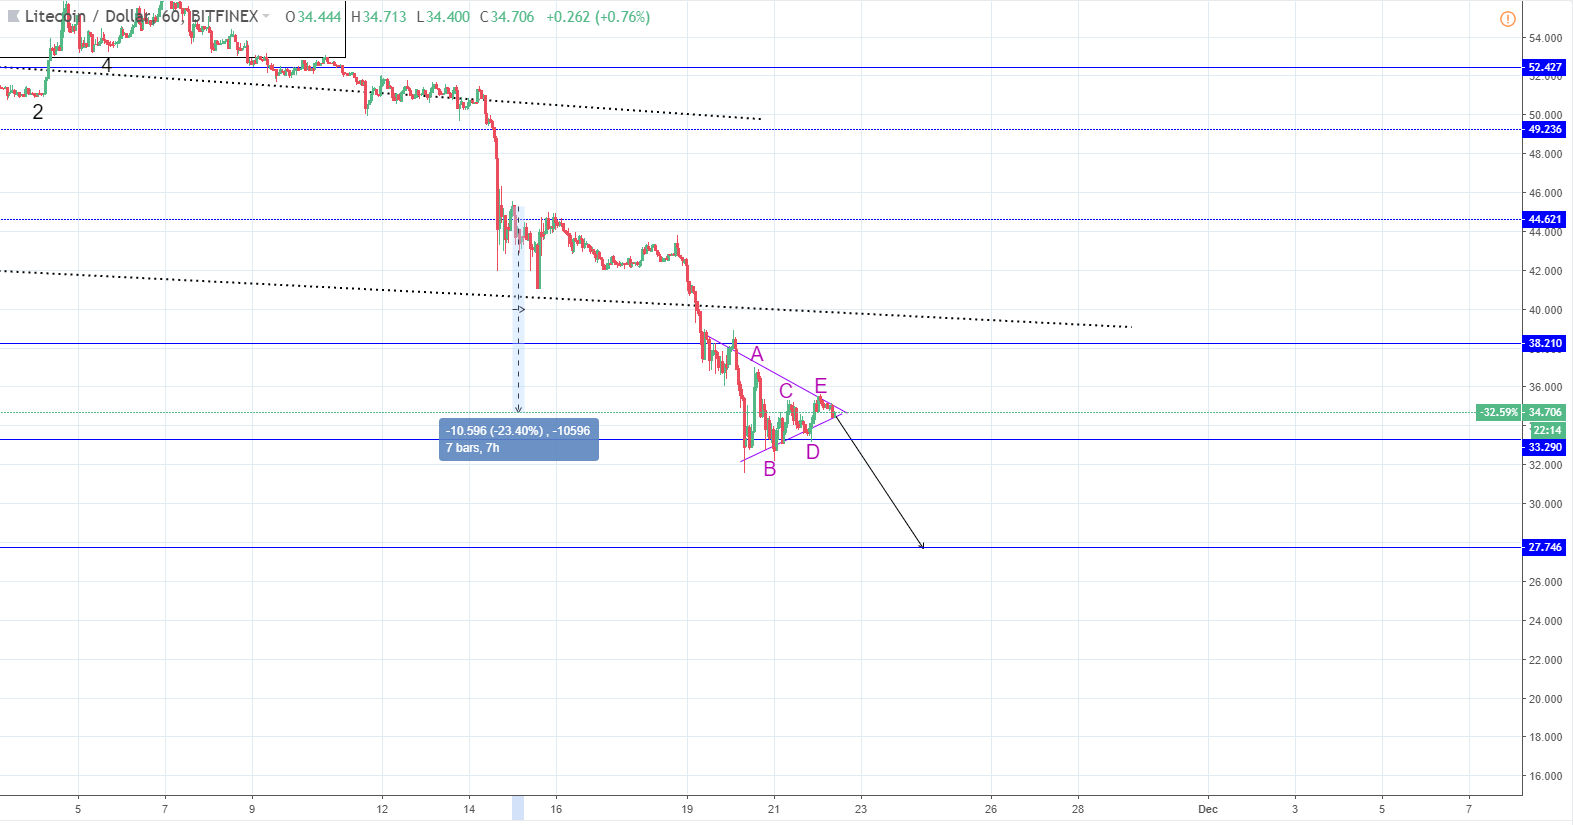
As you can see from the hourly chart, the price went below the descending channels support (black interrupted line) and below the horizontal support level at $38.21. The price found support on the next horizontal support level at $33.29 and has been consolidating above it since then. The consolidation has a symmetrical triangle shape, which indicates equal aggressiveness from both sides.
The sellers are in control over the current market which makes the likelihood of a breakout from the downside a bit higher, so if that happens the next horizontal support level would be at $27.746.
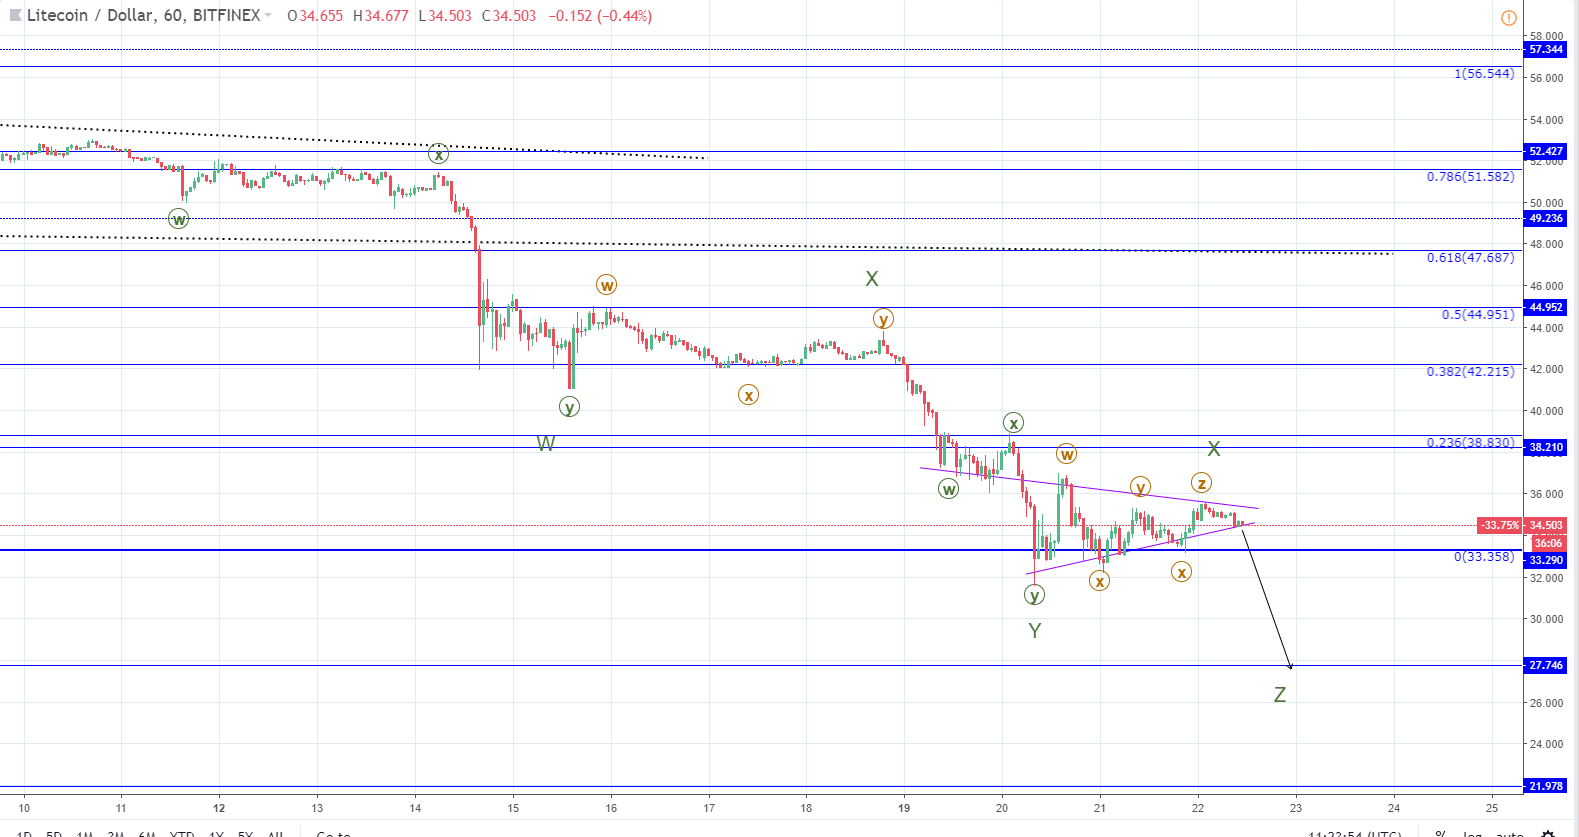
In order to determine the likelihood of a breakout from the downside, I have counted the sub-wave of the current structure and have readjusted the triangle’s support and resistance levels.
As you can see I have counted 4 Minute corrections and the current one is a WXYXZ in the opposite direction, which is inside the triangle previously labeled as an ABCDE. Another correction to the downside is to be expected and that is most likely a three wave WXY, which would be the fifth and final correction or a Z wave from the WXYXZ from a Minor degree.
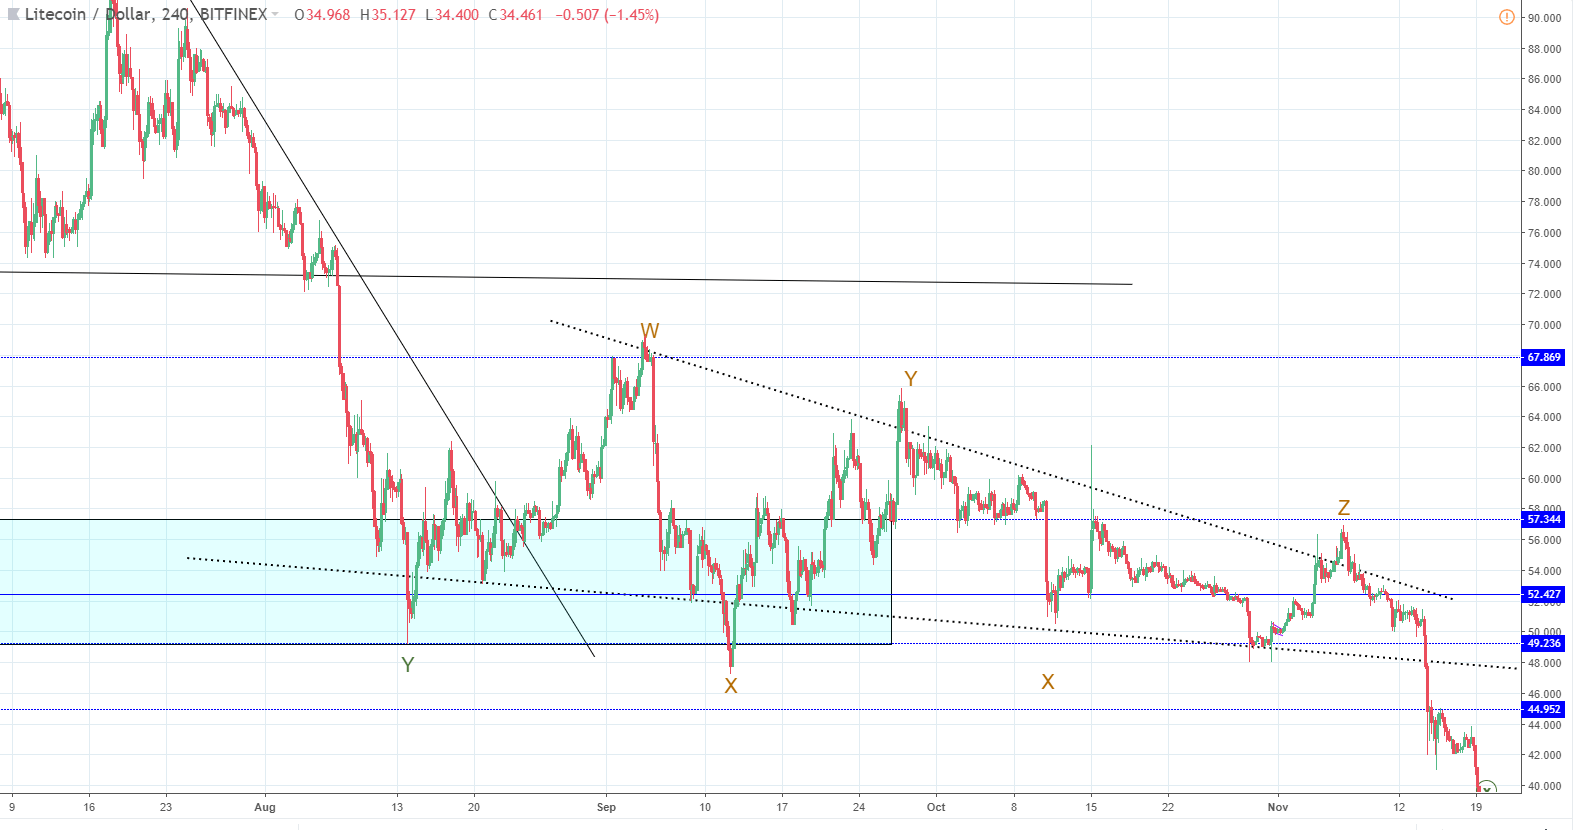
Zooming out to the 4-hour chart and looking at the previous corrective structure, the price has broken out from the downside we can see a clear similarily and market fractality at its finest.
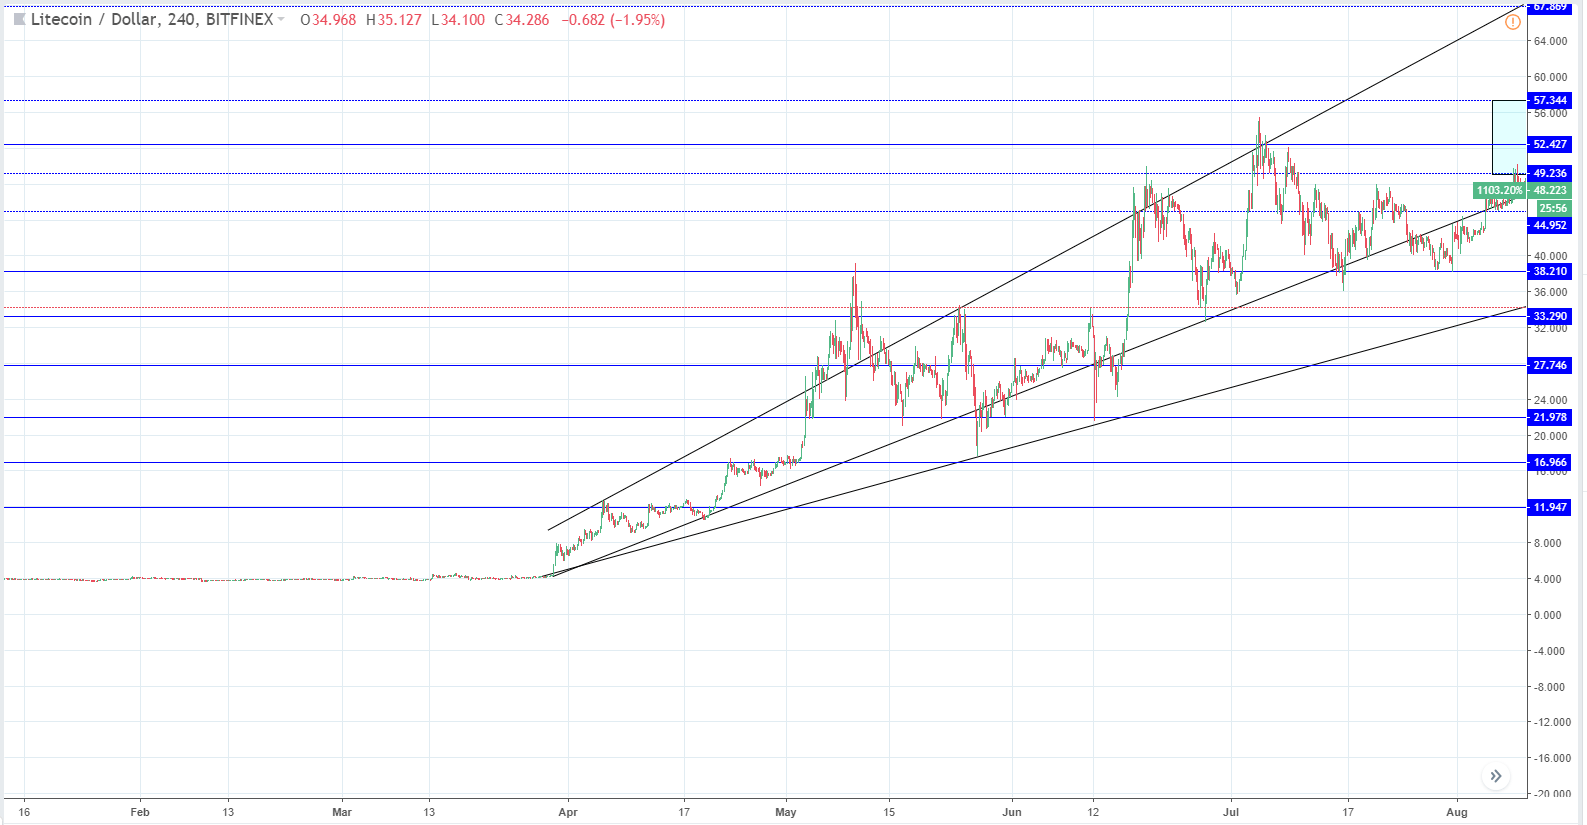
The target for the expected drop would be the horizontal support level from May 2017 and zooming back in time we can see the significance behind the level clearly.
EOS/USD
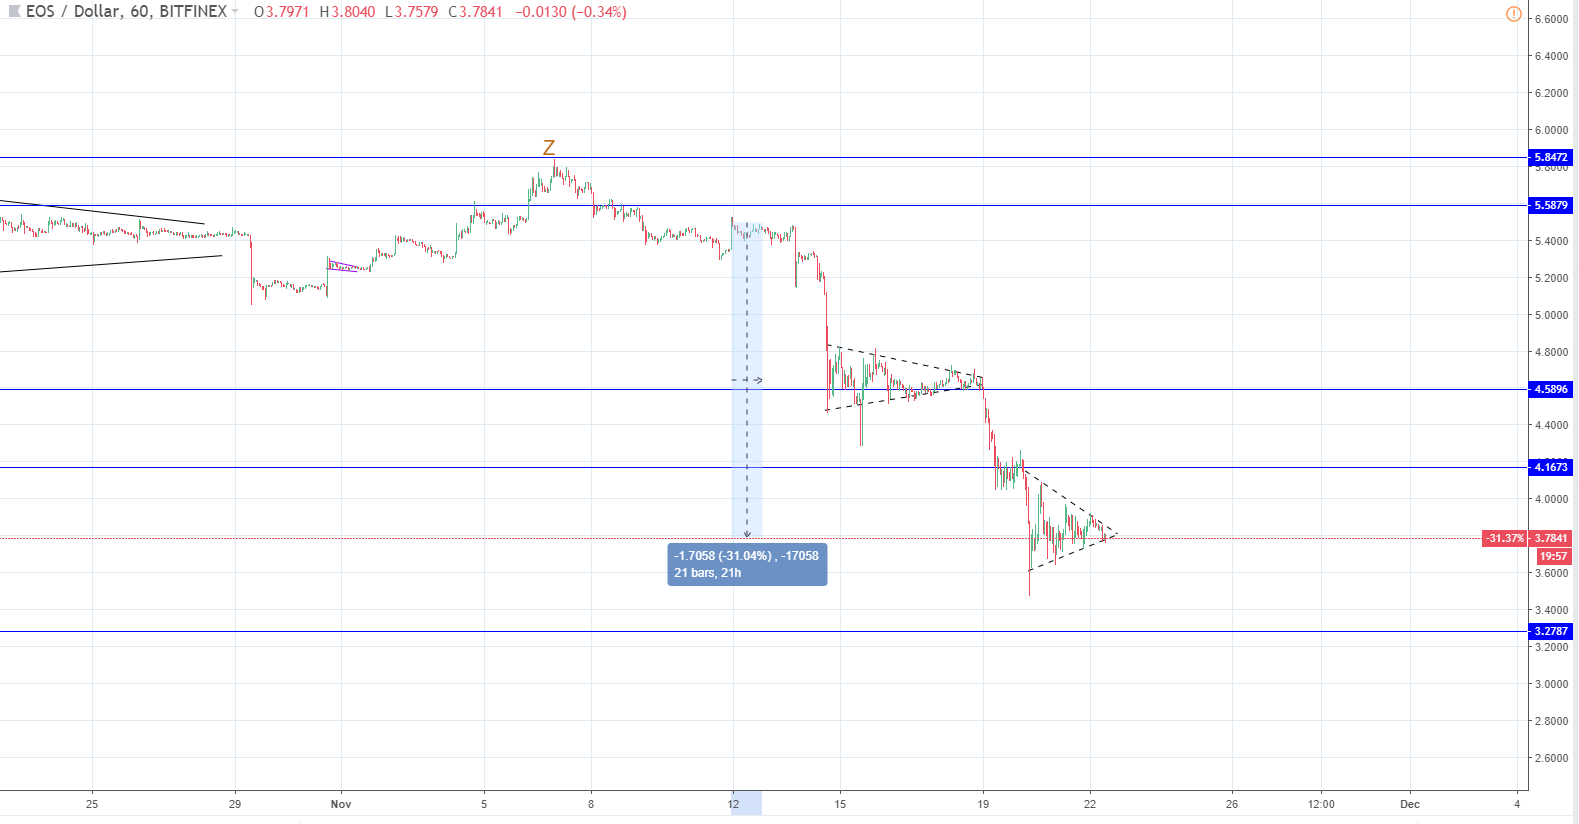
From last Thursday’s open when the price of EOS was at $5.5 we have seen a depreciation of this cryptocurrency of over 31% measured to the current levels of $3.8 per EOS. The price went even lower, spiking down to $3.48 but has recovered quickly leaving a wick on the hourly chart.
Looking at the hourly chart you can see that the price action has created a triangle similarly like in the case of Litecoin and many other cryptos as well. The price has broken the horizontal support level at $4.16 and that is why I believe the next one has to be retested for support. As the price is currently consolidating, we are going to see a breakout soon.
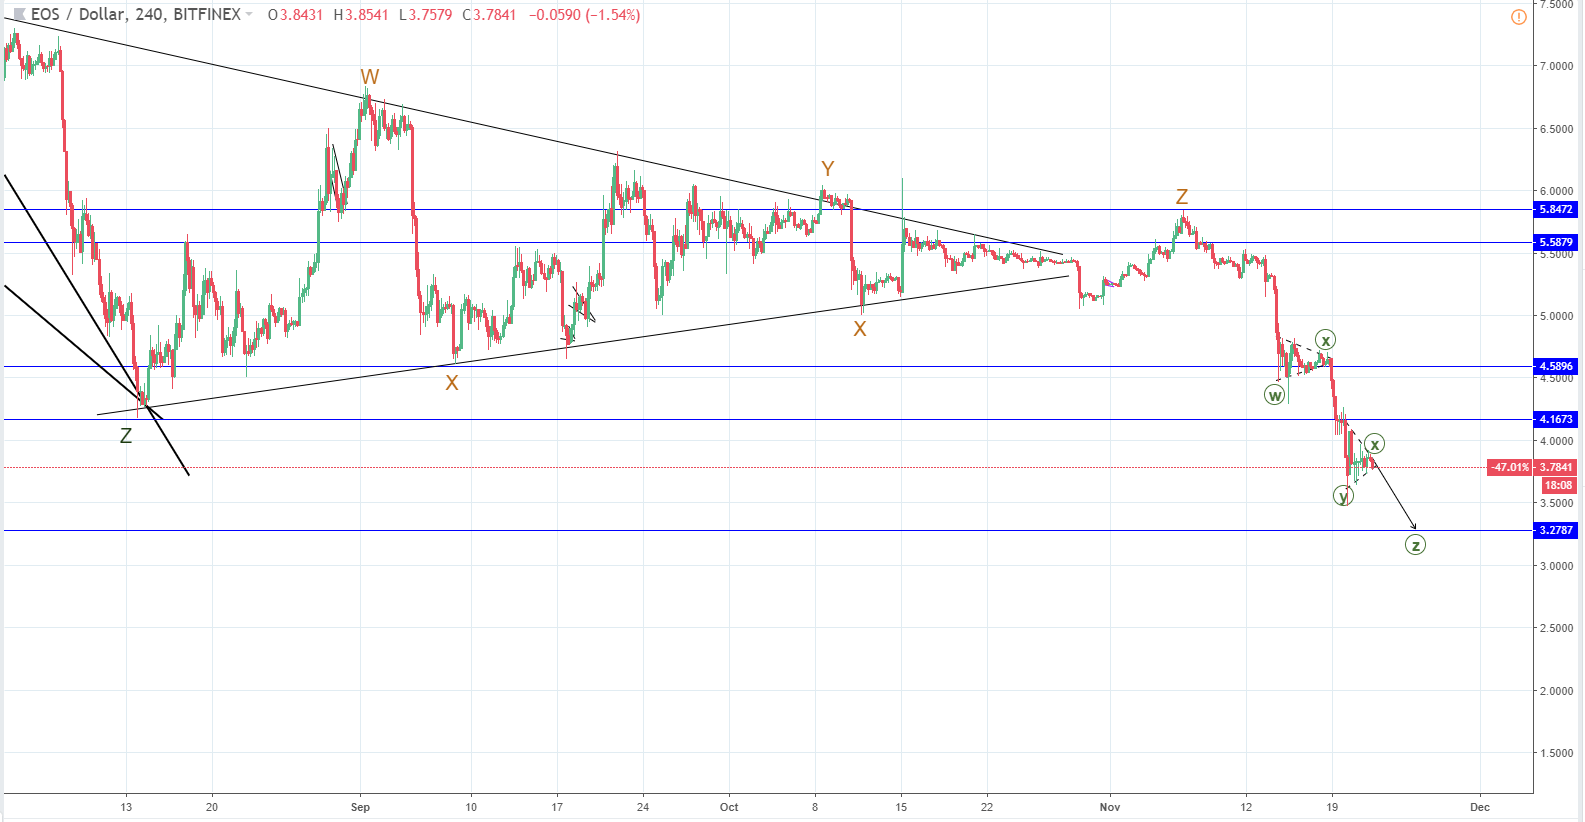
The likelihood of a breakout is even from both sides as the current triangle is symmetrical, but using Elliott Wave Principles to count the waves I determined that the price is most likely heading down much like in the case of Litecoin as the chart structure looks similar.
The target for the awaited decrease would be at the next horizontal support level significant enough that an interaction with it looks likely at $3.27.
As the market is strongly correlated, particularly now it is safe to say that by looking at the charts of the two major cryptos analyzed we are going to see one more low before a recovery.