LTC/USD and EOS/USD - one more spike up before further downside is expected
LTC/USD
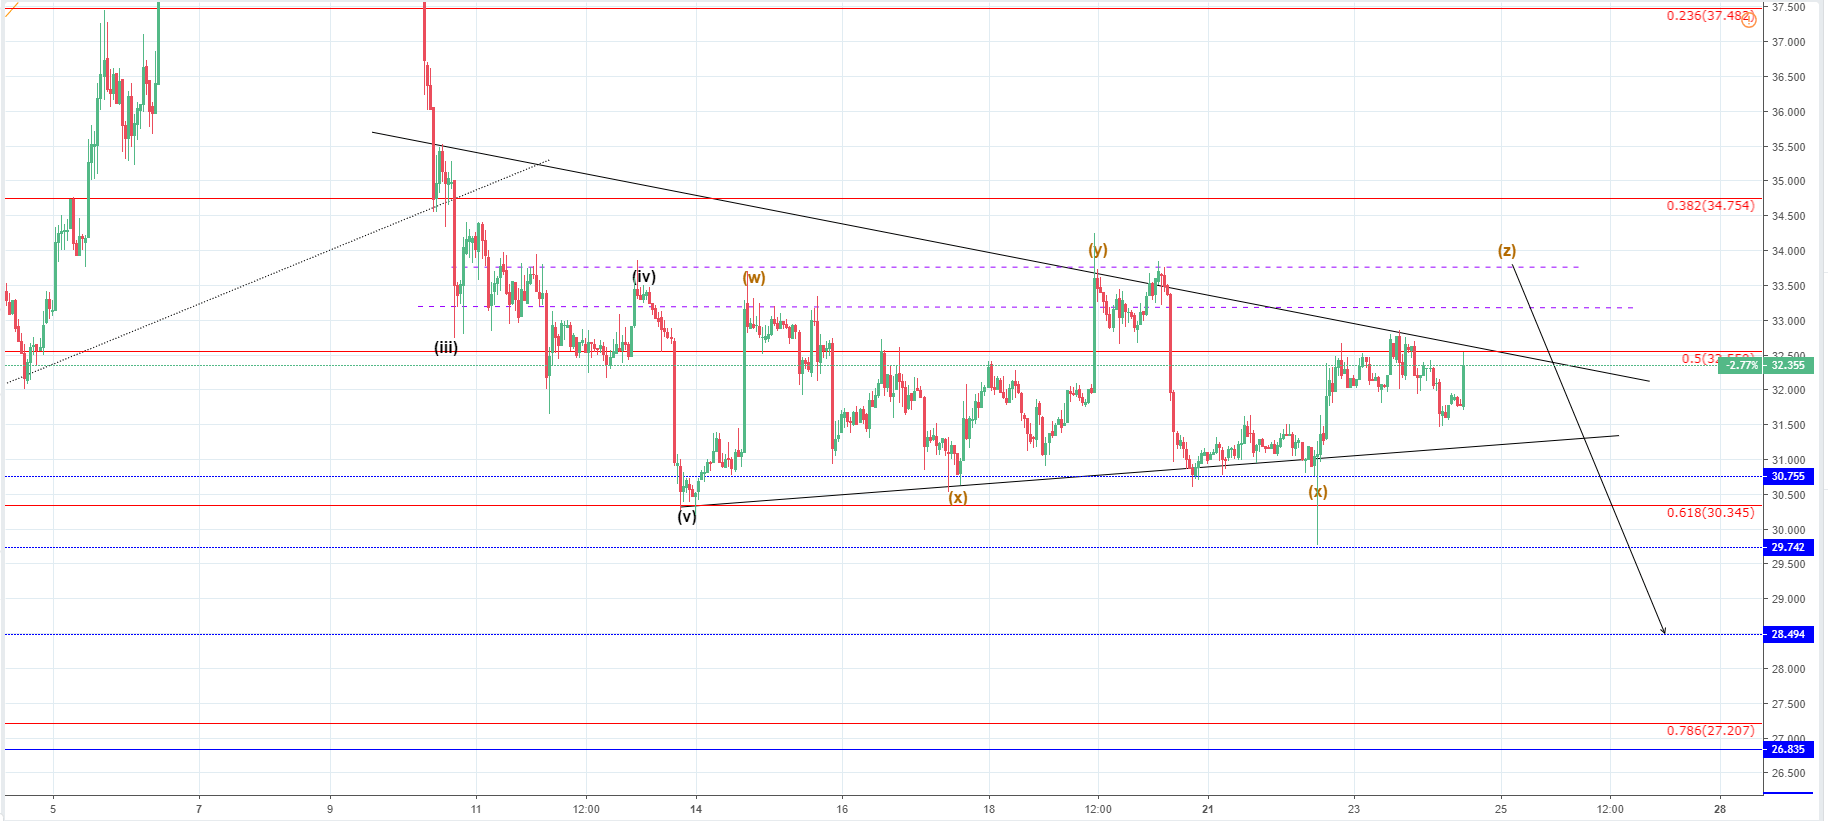
Since last week’s analysis on Thursday 17th when the price of Litecoin was $31.9, the price of the cryptocurrency has been going sideways to $30.755, the lower line from the range, which is stuck, and then to the upper resistance line of the range around $33.742.
Looking at the hourly chart, you can see that the price action created a consolidative range, which looks like a descending triangle between the 0.618 and the 0.5 Fibonacci level. The price went above the 0.5 Fibonacci level on Saturday and interacted with the upper line resistance level at $33.742. After an interaction the price fell quickly down to the range support line at $30.755 and stayed around there retesting it again on around Monday.
On Tuesday the level was retested again, which was the second X wave from a Minuette WXYXZ correction. Then the last Z wave started and the price came up again to the 0.5 Fibo level where it encountered resistance and pulled back to $31.58 and another increase has started.
Considering that the Z wave will most likely be another impulsive move like the W wave, we are likely going to see a breakout from the descending triangle on the upside. But I don’t believe that the price is heading above the upper resistance level from the horizontal range, where the price is correcting. Since the move is only corrective when the increase end, I would be expecting further downside for the price of Litecoin to approximately $28. The price found support there on the first pullback of the impulsive move that lasted to 24th of December. So interaction with that level for a support is most likely, but that might only be the first stop as the price may be going further down.
EOS/USD
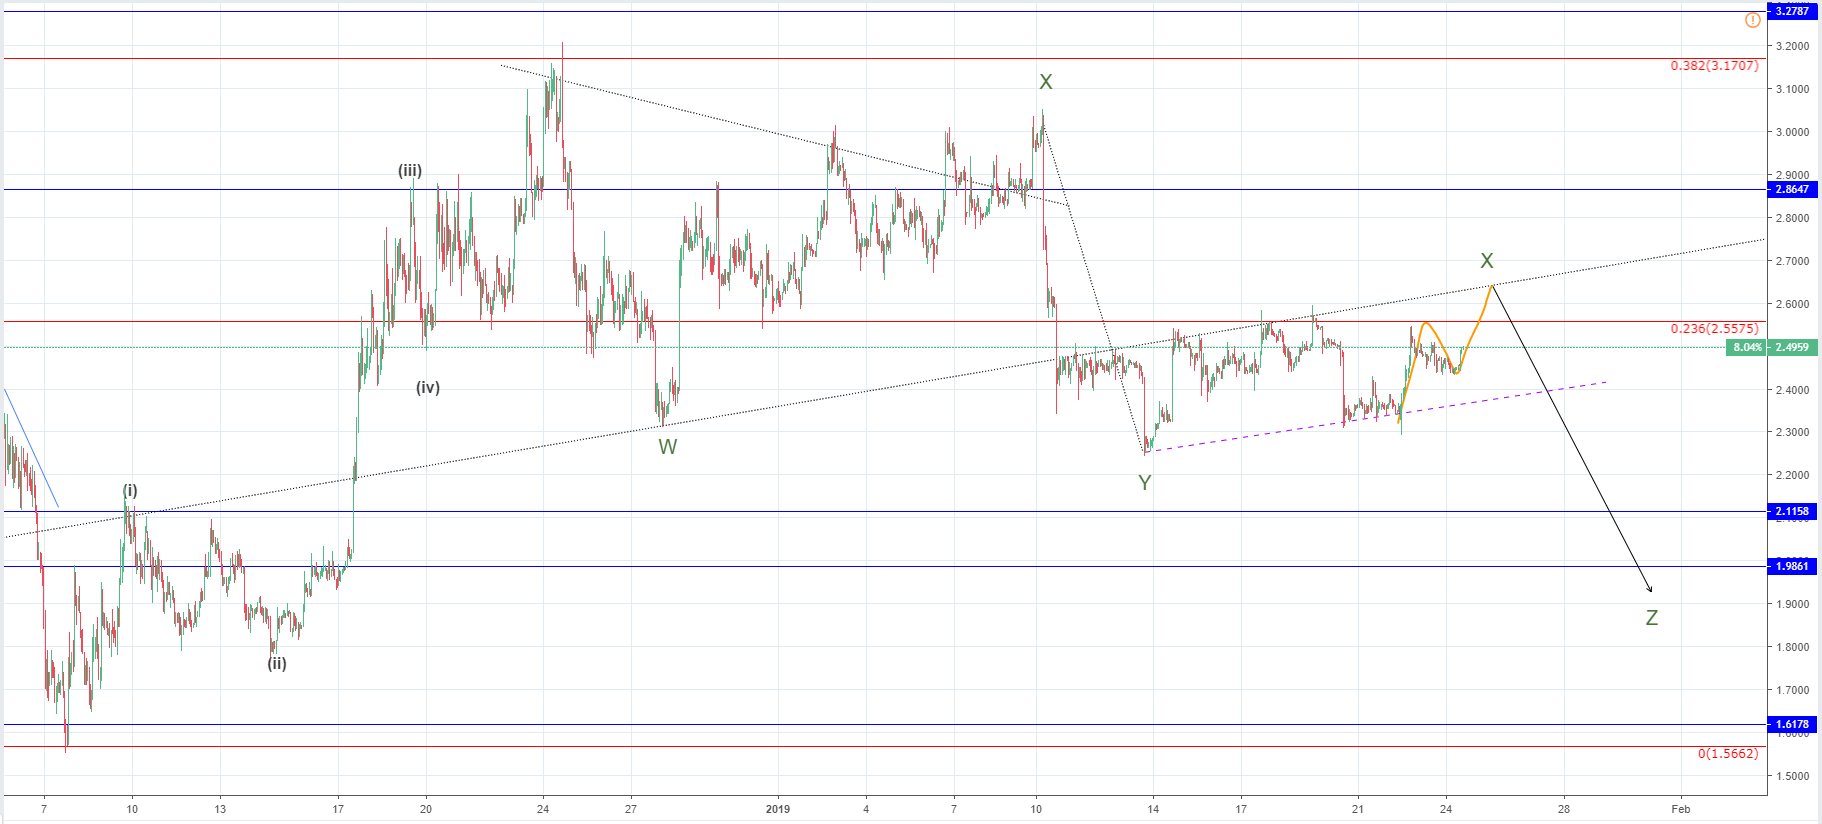
From last Monday 14th, when the price of EOS was at $2.25 at the open, we have seen the price action creating an ascending range with its upper level being at 0.236 and it’s lower a minor uptrend line ,which is parallel to the previous one. It was broken on the Minor Y wave. The price is currently at $2.4945, which is an overall increase of 10.52% measured from last Monday.
On the hourly chart you can see the refereed range in which the price action has been bouncing. It is labeled as the second X wave from a WXYXZ of a Minor degree. As the wave structure inside the range looks corrective, we are going to see a significant decrease in price as the Z wave should push the price significantly lower from the current levels. But before the Z wave starts the second X wave needs to fully develop. That is why I think that we are going to see another move to the upside before this expected decrease.
The target for the expected increase would be on the previous uptrend support line, which now serves resistance and was interacted previously. The 0.236 Fibonacci level is also serving as strong resistance but I don’t believe that it will stop the price now as it’s caught some bullish momentum. The area is going to serve as resistance, and that is why after the interaction more downside is expected. But since the Z wave hasn’t been activated by the interaction with the 0.236 level, the sellers are likely looking for a “better” price, and a small spike above the mentioned level just might activate that selling momentum that is needed for the price to start the final stage of the Minor correction.
The target price for the expected decrease would be around $2 area where the most significant horizontal level is, but it could end up both higher or lower than that.