


Mastering Multiple Timeframe Trading Strategies
FXOpen

In the fast-paced world of trading, the ability to analyse and interpret multiple timeframes can be one of the advantages of a trader. In this FXOpen article, we will delve into the concept of multiple timeframes in trading and consider two multiple timeframe trading strategies based on it.
Understanding Multiple Timeframes
Multiple timeframes refer to the simultaneous analysis of price data across charts with different periods. This approach allows traders to gain a comprehensive view of the market's dynamics. The use of multiple timeframes is paramount in trading for several reasons. By analysing various time intervals, traders may:
- Properly analyse the overall market trend.
- Identify potential entry and exit points.
- Enhance risk management by assessing the broader context.
- Avoid being trapped by short-term market noise and false signals.
Selecting Timeframes
Trading on multiple timeframes usually means confirming signals on charts with two or three different periods. More intervals may confuse traders with excessive market noise.
Choosing the Primary Timeframe
The primary timeframe serves as the foundation of your trading strategy. It's essential to select a primary timeframe that resonates with your trading style and objectives. Here's why it matters:
- Alignment with Trading Style: Your primary timeframe should align with your preferred trading style. For example, if you are a day trader looking for quick, short-term opportunities, a primary timeframe of 1-hour or 15-minute charts may be suitable. On the other hand, if you are a swing trader seeking more extended trends, daily or weekly charts might be your primary choice.
- Clarity of Signals: The primary timeframe should provide clear and actionable signals. It's the timeframe where you identify key support and resistance levels, chart patterns, and trend directions. The primary timeframe is where you make your core trading decisions.
Selecting Secondary Timeframes
While the primary timeframe forms the core of your strategy, the secondary one complements and reinforces your analysis. These secondary timeframes offer additional perspectives and confirmation. Here's how you may choose one:
- Alignment with Primary Timeframe: Secondary timeframes should align with your primary period. For instance, if your primary period is the daily chart, you may consider a secondary interval, such as 4-hour or 1-hour charts. The secondary timeframes should provide a more detailed view without straying too far from your primary analysis.
- Confirmation and Entry Timing: Use secondary timeframes to confirm signals from your primary analysis. When the primary chart generates a potential trade signal, consult the secondary one to validate it. This additional confirmation may enhance the reliability of your decisions and help you time your entries more accurately.
- Managing Risk: Secondary timeframes can also assist in managing risk. By assessing shorter periods, you can identify intraday fluctuations and adjust your stop-loss and take-profit levels accordingly.

Multiple Timeframe Trading Strategies
Below, you will find two trading strategies that use multiple time frames to trade.
Swing Trading Strategy with Multiple Timeframes
Timeframes Used:
- Primary: Daily Chart
- Secondary: 4-Hour Chart
Indicators and Tools:
- Exponential Moving Averages (EMA) - 14-period and 21-period
- Relative Strength Index (RSI) - 14-period
- Fibonacci Retracement Tool
Entry and Exit Points:
- Entry Point (Long Trade):
When the daily chart shows an uptrend (a 14-period EMA above a 21-period EMA) and an RSI above 50, and the 4-hour chart reveals a pullback to a Fibonacci support level:
- You may enter a long trade with a stop-loss just below the support level on the 4-hour chart.
- You may set a take-profit target at a resistance level or when the 4-hour chart shows signs of a potential reversal.
- Entry Point (Short Trade):
When the daily chart indicates a downtrend (a 14-period EMA below a 21-period EMA) and an RSI below 50, and the 4-hour chart exhibits a retracement to a Fibonacci resistance level:
- You may enter a short trade with a stop-loss just above the resistance level on the 4-hour chart.
- You may set a take-profit target at a support level or when the 4-hour chart reflects a potential reversal.
You may use trailing stop-loss to partially close your trade and lock in the returns that have already been reached.
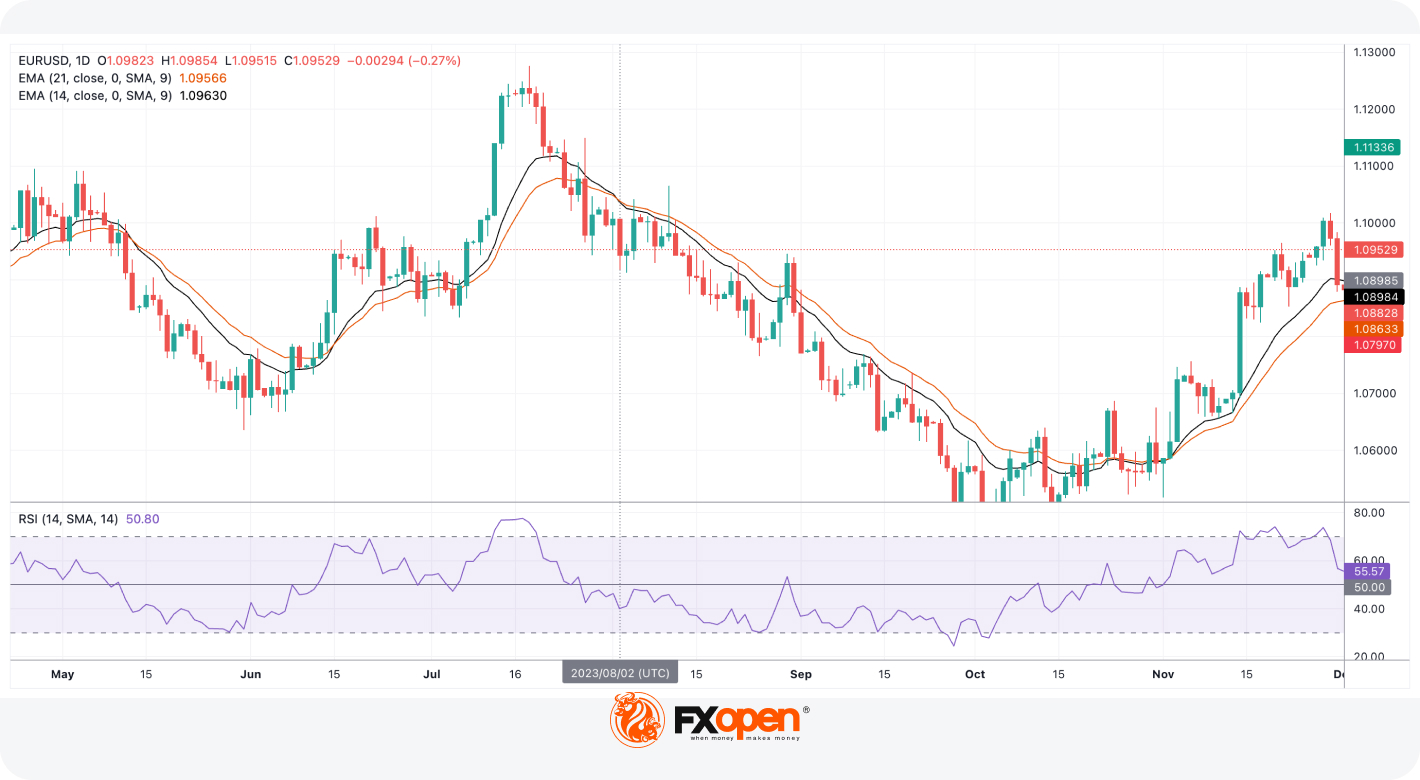
On the chart above, the 14-day EMA broke below the 21-day EMA, while the RSI indicator was below 50. A trader could have considered this as a signal to open a short position.
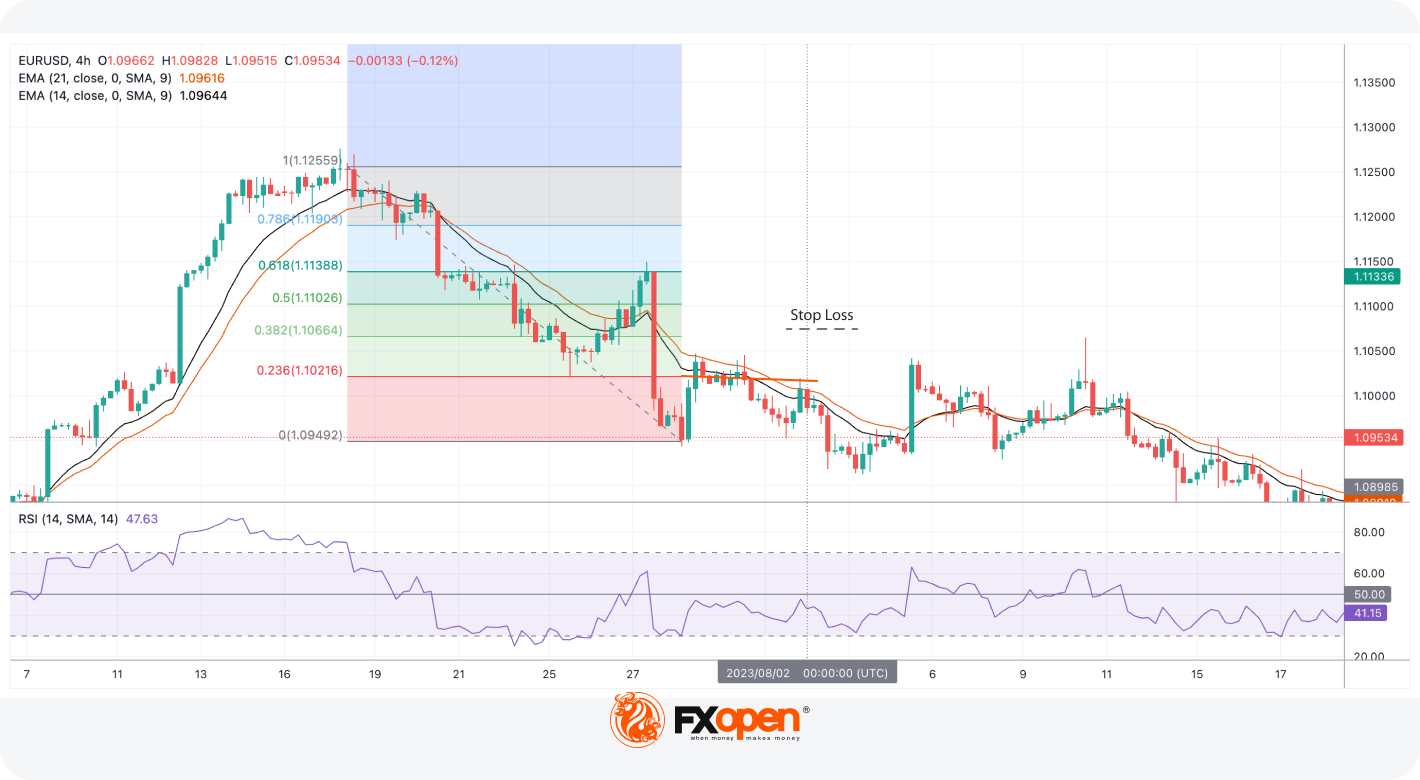
When the trader switched the timeframe, they may have noticed that the price rebounded from the 23.6% Fibonacci level. This could be considered as an entry point. A stop-loss could have been placed above the closest Fibonacci level (38.2% in this case) to fulfil a standard risk/reward ratio. The take-profit target would depend on the trader’s trading approach.
Multiple Timeframe Analysis for Day Trading
Timeframes Used:
- Primary: 15-Minute Chart
- Secondary: 1-Hour Chart
Indicators and Tools:
- Exponential Moving Averages (EMA) - 9-period and 50-period
- Relative Strength Index (RSI) - 14-period
- Support and Resistance Levels
Entry and Exit Points:
- Entry Point (Long Trade):
When the 15-minute chart shows an uptrend (a 9-period EMA above a 50-period EMA), the RSI indicates bullish momentum, and the 1-hour chart confirms a support level:
- You may enter a long trade with a stop-loss just below the support level on the 15-minute chart.
- You may set a take-profit target at a resistance level or when the 15-minute chart reflects a potential reversal.
- Entry Point (Short Trade):
When the 15-minute chart indicates a downtrend (a 9-period EMA below a 50-period EMA), the RSI indicates bearish momentum, and the 1-hour chart confirms a resistance level:
- You may enter a short trade with a stop-loss just above the resistance level on the 15-minute chart.
- You may set a take-profit target at a support level or when the 15-minute chart reflects a potential reversal.
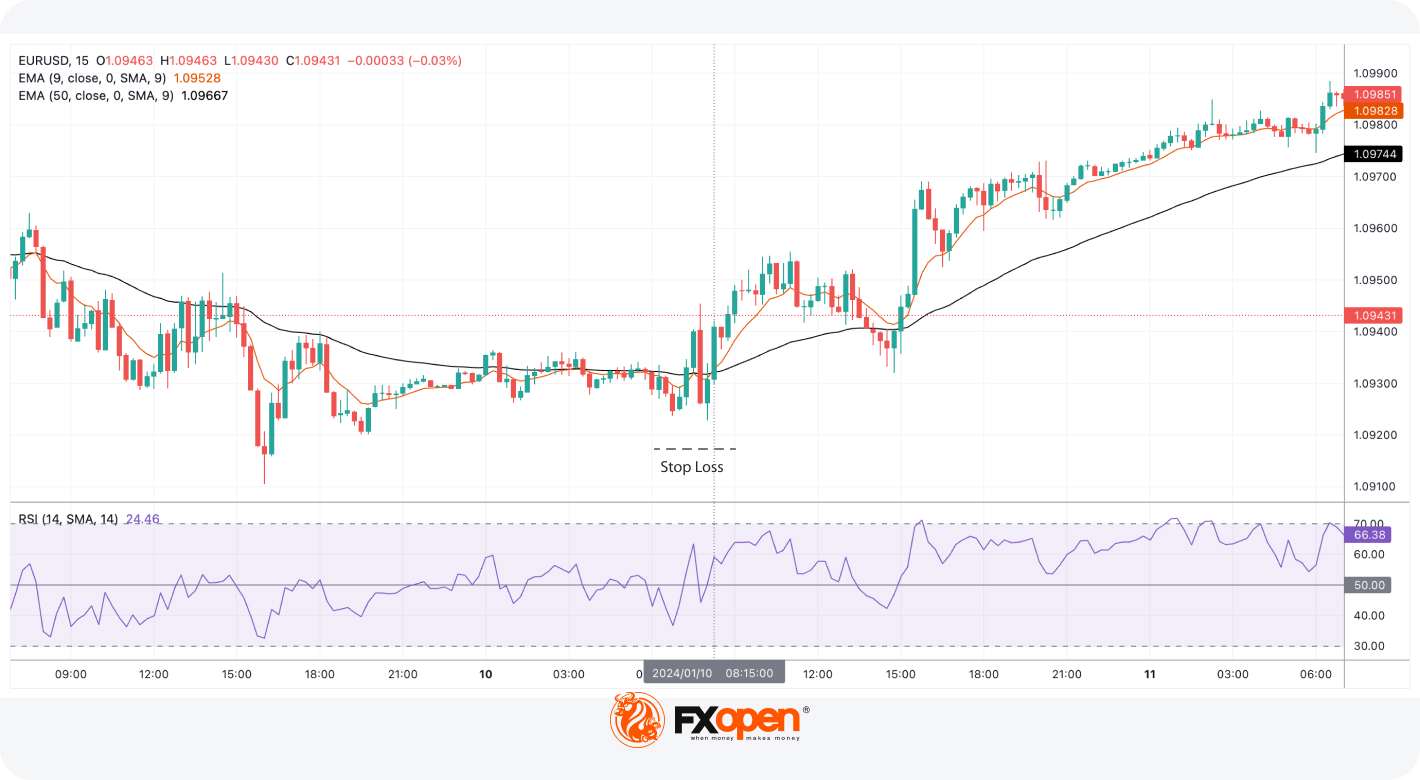
On the chart above, created on the TickTrader platform, a trader may have spotted conditions for a long trade (the 9-period EMA was above the 50-period EMA, and the RSI indicator was above 50).
Checking the hourly chart, they may have noticed that the conditions occurred when the price rebounded from the support level. Moreover, the RSI indicator broke above the 50 level, signalling potential upward movement.
A trader could have opened a long position with a stop-loss order below the most recent swing point.
Mistakes to Avoid
Trading on multiple timeframes may be a powerful approach to gaining a comprehensive overview of the market and making more informed trading decisions. However, it also introduces complexities that traders need to navigate carefully. Here are some common mistakes to avoid:
Neglecting the Primary Timeframe. One of the most significant mistakes is focusing too heavily on the secondary timeframe and neglecting the primary one. The primary one provides the overall trend direction and context, so it's essential not to lose sight of it.
Overcomplicating Analysis. Trading on multiple timeframes can become overwhelming if you overcomplicate your analysis. Using too many multi-timeframe indicators, tools, or charts can lead to analysis paralysis. Keep your approach simple and effective.
Ignoring Conflicting Signals. It's not uncommon for different periods to produce conflicting signals. Avoid the mistake of trading solely based on one chart without considering the broader context. Conflicting signals should prompt caution and further analysis.
Chasing Short-Term Trends. Day traders may sometimes fall into the trap of chasing short-term trends on very small periods. Avoid the mistake of becoming too focused on micro-trends without considering the bigger picture.
Overlooking Risk Management. Regardless of their trading approach, traders should use proper risk management. It's essential to set stop-loss and take-profit levels based on your analysis and risk tolerance for each trade.
Neglecting the Market Context. Trading solely based on technical analysis from multiple timeframes may lead to neglecting the broader market context. Be aware of significant economic events, news releases, or geopolitical factors that could impact the market.
Final Thoughts
Trading on multiple timeframes can be a potent tool when used correctly, but it also comes with its challenges. Avoiding the common mistakes and maintaining discipline in your analysis and execution may lead to more effective trading. If you want to test multi-timeframe trading strategies, open an FXOpen account now!
This article represents the opinion of the Companies operating under the FXOpen brand only. It is not to be construed as an offer, solicitation, or recommendation with respect to products and services provided by the Companies operating under the FXOpen brand, nor is it to be considered financial advice.
Stay ahead of the market!
Subscribe now to our mailing list and receive the latest market news and insights delivered directly to your inbox.


Latest articles

Nasdaq 100: Is This the Correction Traders Have Been Waiting For?
The Nasdaq 100 (US Tech 100 Mini on FXOpen) remains caught between two opposing forces: cooling inflation on one side, and persistent geopolitical instability on the other. On 14 July, June's CPI print came in softer than expected, easing near-term

XRP/USD: Symmetrical Triangle Forms as Trading Volume Fades
On 6 July, Ripple received a full Crypto-Asset Service Provider (CASP) licence under the Markets in Crypto-Assets (MiCA) regulation from Luxembourg's financial regulator, the CSSF. The approval allows the company to offer regulated crypto payment services across all 30 countries

AI Valuations Are Back in the Spotlight
Artificial intelligence remains the dominant investment theme of 2026, but investors are increasingly questioning whether AI stock valuations are keeping pace with reality.
💰 Big Tech continues to invest at an unprecedented scale, with hyperscaler AI spending projected to exceed $800