


BTC/USD: Bullish Engulfing Pattern Above $26,981
FXOpen

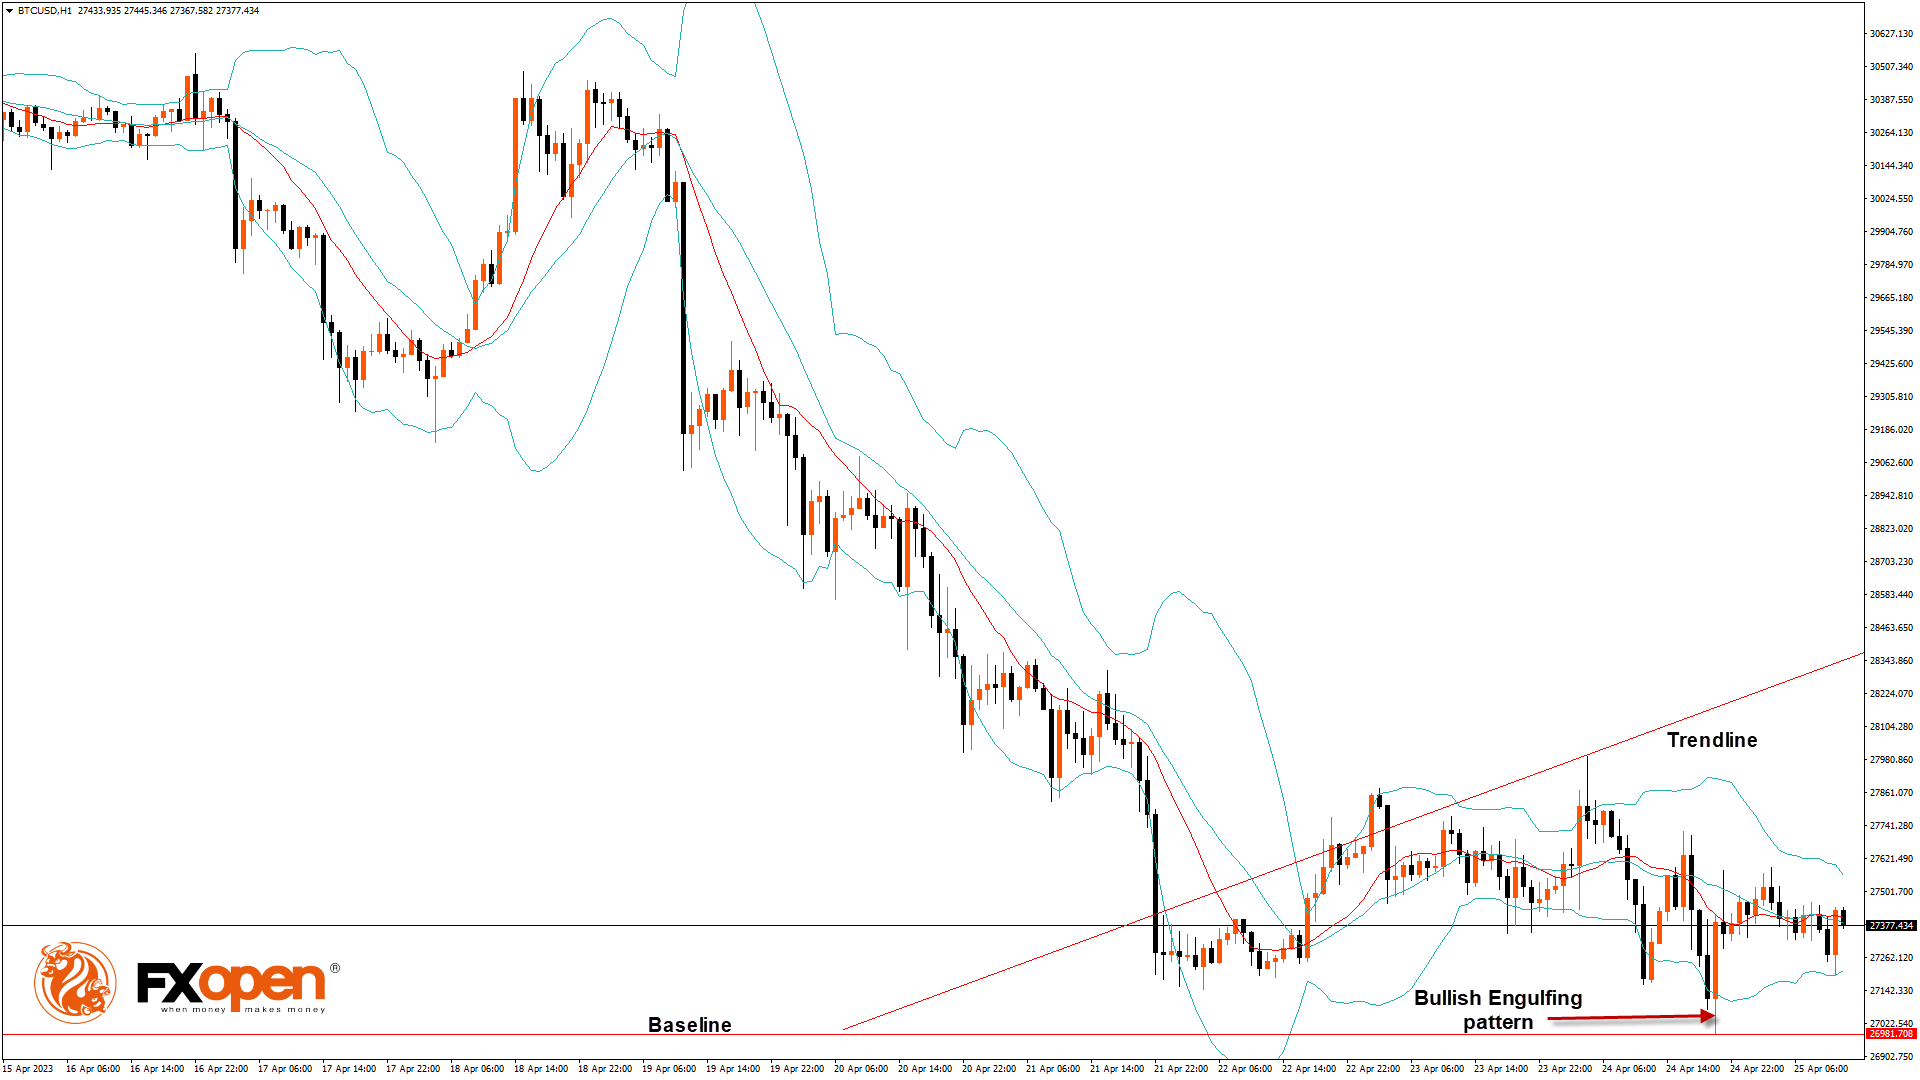
Bitcoin continues its bullish momentum from last week, and after touching a low of $26,981 on April 24, we can see a move towards a consolidation phase, after which we are expecting upsides in the range of $28500 and $302000.
We can clearly see a bullish engulfing pattern above the $26,981 handle on the H1 timeframe.
Bitcoin continues to move in a consolidation phase, after which we can see upside moves towards the $28,000 handle.
Both the STOCH and Williams’ percent range indicate overbought levels, which means that in the immediate short term, a decline in the price is expected.
We can also see the formation of bullish Harami pattern in the 1, 2 and 4 hourly timeframes.
The relative strength index is at 58.23, indicating a strong demand for Bitcoin and the continuation of the buying pressure in the markets.
Bitcoin is now moving above its 200-hour exponential moving average and above its 200-hour exponential moving average.
Most of the major technical indicators are giving a bullish signal, which means that in the immediate short term, we are expecting targets of $28,500 and $30,000.
The average true range indicates high market volatility with mild bullish momentum.
- Bitcoin bullish continuation is seen above $26,981.
- The RSI remains above 50, indicating a bullish market.
- The price is now trading below its pivot level of $28,516.
- The short-term range is mildly bullish.
- Some major technical indicators signal that the price may move to $28,000 and $29,500 soon.
Bitcoin Bullish Continuation Seen Above $26,981
The price of Bitcoin entered a consolidation zone below the $28,000 handle after which we can see the start of the bullish moves.
There is a bullish trend reversal pattern with adaptive moving average AMA-20 and AMA-50 in the 30-minutes timeframe.
The prices are ranging near the support of the triangle in the 1-hourly timeframe.
We have also seen a Bullish Doji located in the 15-minutes timeframe.
A support zone is located at $26,246, which is a 3-10 Day MACD Oscillator Stalls, and at $26,624, which is a 38.2% Retracement from 13 Week High.
BTCUSD is now facing its classic resistance level of $28,015 and Fibonacci resistance level of $28,508, breaking which the price will be able to move to $29,000.
There is an increase of 4.64% in the daily trading volume, which is normal. The short-term outlook for Bitcoin is bullish, the medium-term outlook has turned bullish, and the long-term outlook remains neutral under present market conditions.
The Week Ahead
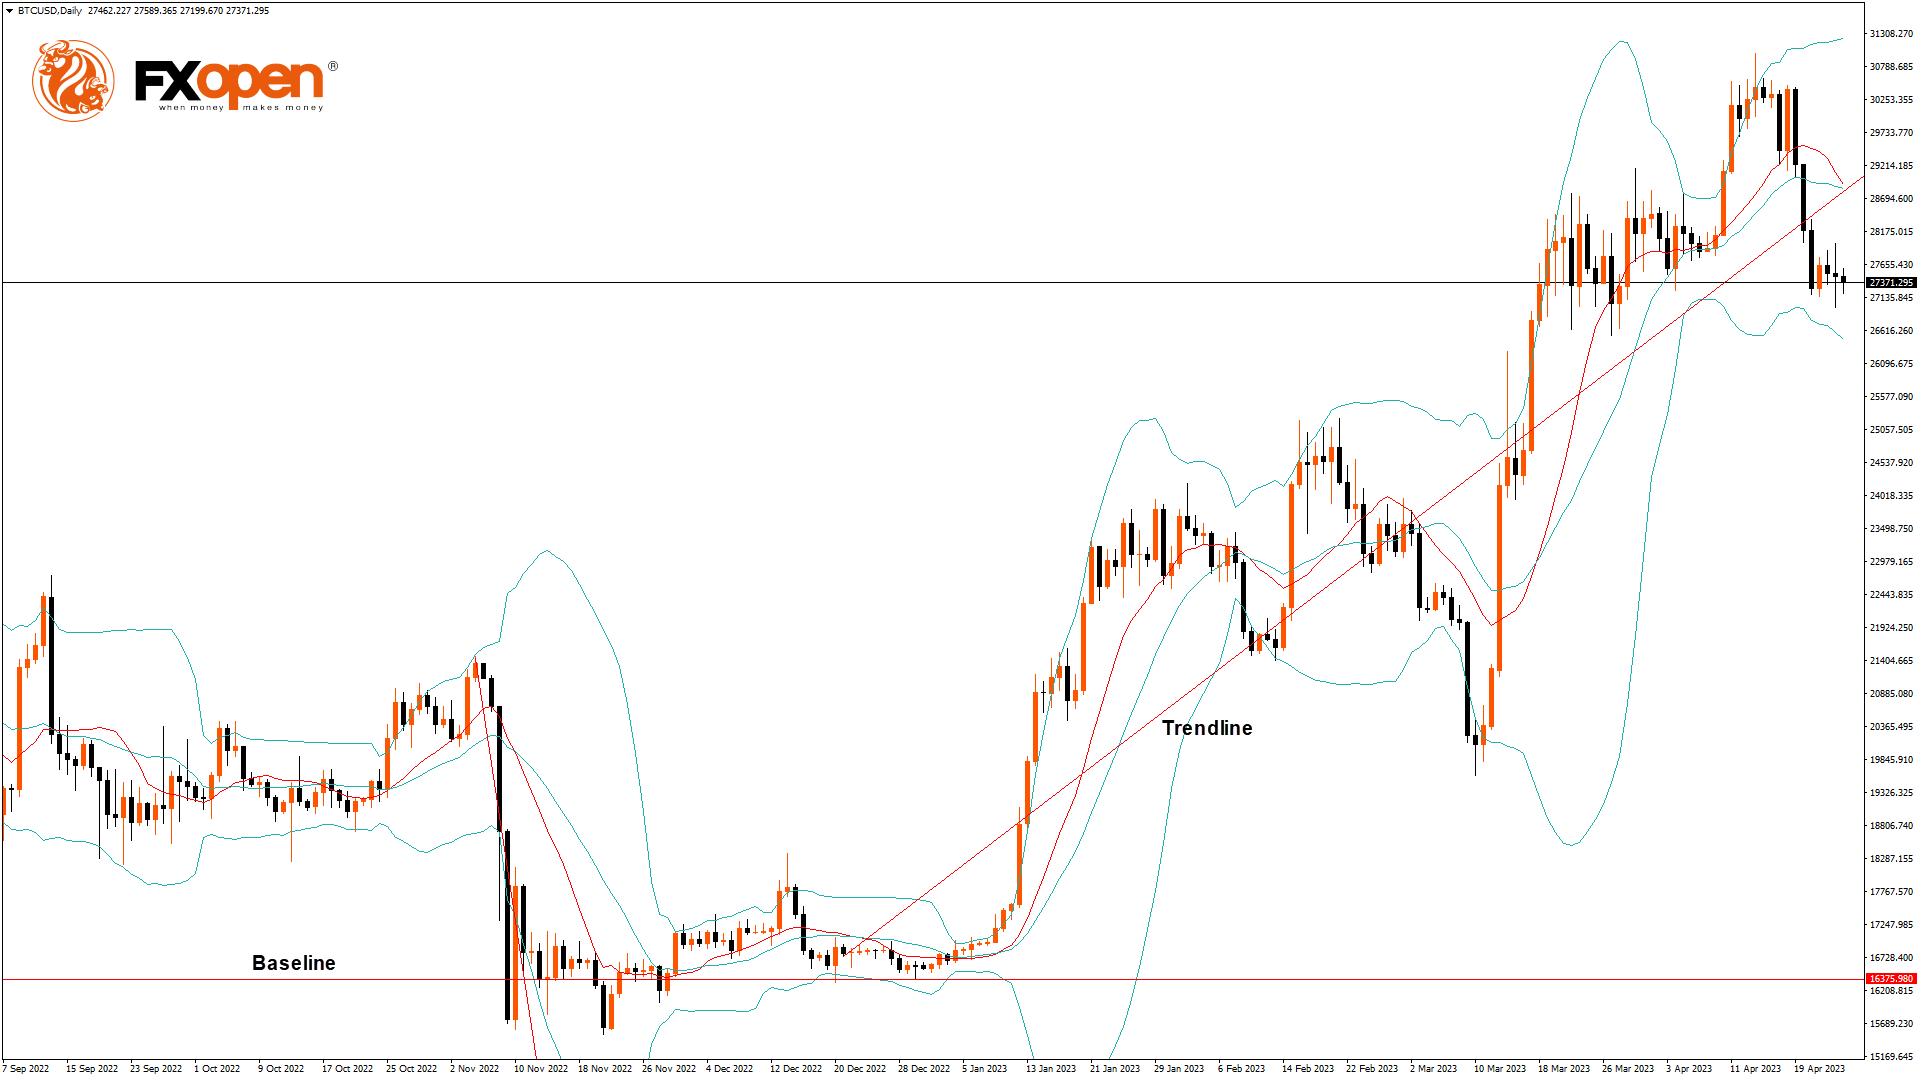
We can see that Bitcoin remains well supported above the $27,000 handle and the continuation pattern is seen, with the current support at $25,143, which is a 38.2% Retracement from 52-week low.
The immediate expected target is $29,000, after which we may see some consolidation in the zone of the $29,500 level.
Monthly RSI is at 49.68, which indicates the Neutral market and the shift towards the consolidation zone in the medium-term range.
We can see the formation of a bullish trend line from $26,981 to $28,355.
BTCUSD is now facing resistance at $27,943, which is a pivot point 1st resistance point, and at 28,152, at which the price crosses 18 day moving average stalls.
This article represents FXOpen Companies’ opinion only, it should not be construed as an offer, solicitation, or recommendation with respect to FXOpen Companies’ products and services or as financial advice.
FXOpen offers the world's most popular cryptocurrency CFDs*, including Bitcoin and Ethereum. Floating spreads, 1:2 leverage — at your service (additional fees may apply). Open your trading account now or learn more about crypto CFD trading with FXOpen.
*Important: At FXOpen UK, Cryptocurrency trading via CFDs is only available to our Professional clients. They are not available for trading by Retail clients. To find out more information about how this may affect you, please get in touch with our team.
This article represents the opinion of the Companies operating under the FXOpen brand only. It is not to be construed as an offer, solicitation, or recommendation with respect to products and services provided by the Companies operating under the FXOpen brand, nor is it to be considered financial advice.
Stay ahead of the market!
Subscribe now to our mailing list and receive the latest market news and insights delivered directly to your inbox.


Latest articles

AI Valuations Are Back in the Spotlight
Artificial intelligence remains the dominant investment theme of 2026, but investors are increasingly questioning whether AI stock valuations are keeping pace with reality.
💰 Big Tech continues to invest at an unprecedented scale, with hyperscaler AI spending projected to exceed $800

AUD/CAD: Months of Indecision — Is a Breakout Finally Coming?
The Australian dollar has clawed back most of its end-of-June losses, when it touched three-month lows against the greenback amid escalating Middle East tensions. Since then, sentiment has improved: the RBA's Assistant Governor Sarah Hunter signalled the board stands ready

USD/JPY: Battling at the Top of the Triangle
On 3 July, Japan's Finance Minister, Satsuki Katayama, stated that the Ministry of Finance remains in close contact with US authorities regarding developments in USD/JPY as the yen traded near its weakest level in almost 40 years. Similar verbal