


XRPUSD Analysis: Bearish Doji Star Pattern below $0.4706
FXOpen
Ripple was unable to continue its bullish momentum from last week, and after touching a high of $0.4706 on May 05, we can see a continuous decline in the Ripple price, with immediate targets located in the range of $0.4000 and $0.3800.
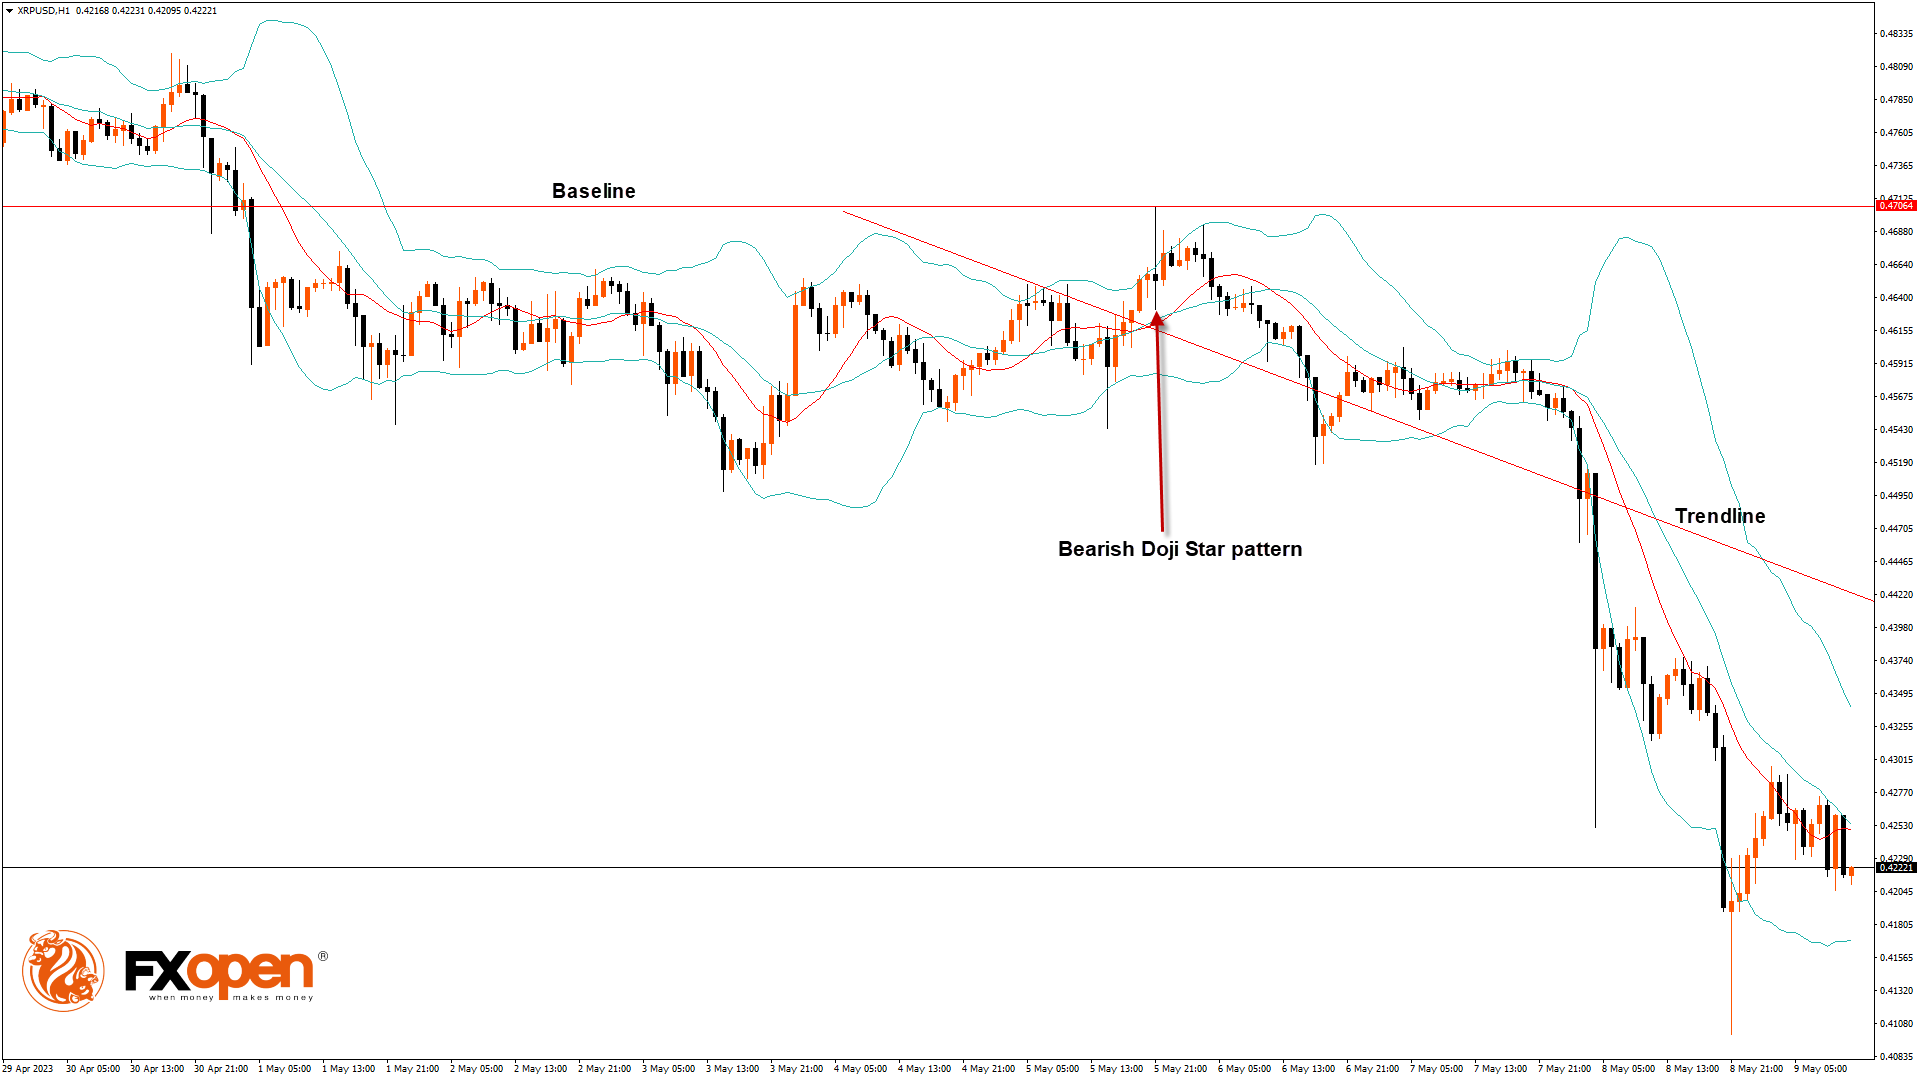
On the hourly chart:
- The relative strength index is at 39.25, which signifies a very weak demand for Ripple at the current market prices and the continuation of the bearish phase in the market.
- Moving averages signal a downward price movement at the current market level of 0.4236.
- The Ultimate oscillator is in the neutral zone, which means the price is expected to consolidate further.
- Ripple is now trading just above its pivot level of 0.4229 and is facing its classic support at 0.4153 and facing Fibonacci support at 0.4211, after which it will be able to move towards 0.4000.
- The markets opened bearish this week.
- Ripple to USD exchange rate is ranging near a new record low for one month.
Some of the major technical indicators are bearish.
- Ripple bearish reversal is seen below 0.4706.
- The price is just above its pivot level.
- Average true range indicates less volatility.
- RSI is back under 50.
- Ichimoku price is under the cloud, indicative of the bearish pressure.
We have also detected the formation of bearish engulfing lines in the 4-hourly timeframe.
Ripple Bearish Reversal Seen below $0.4706
We can see that Ripple continues to move bearish, and further downsides are located at 0.4000 and 0.3800. There is a bearish trend reversal pattern with the adaptive moving average AMA20 and AMA50 in the weekly timeframe.
With a weak global investor sentiment we are looking to enter into a consolidation phase after the recent decline in the prices of Ripple.
The short-term outlook for Ripple has turned bearish, the medium-term outlook is bearish, and the long-term outlook is neutral.
We can see an increase of around 5.05% in the trading volumes of Ripple as compared to yesterday, which is normal.
This Week Ahead
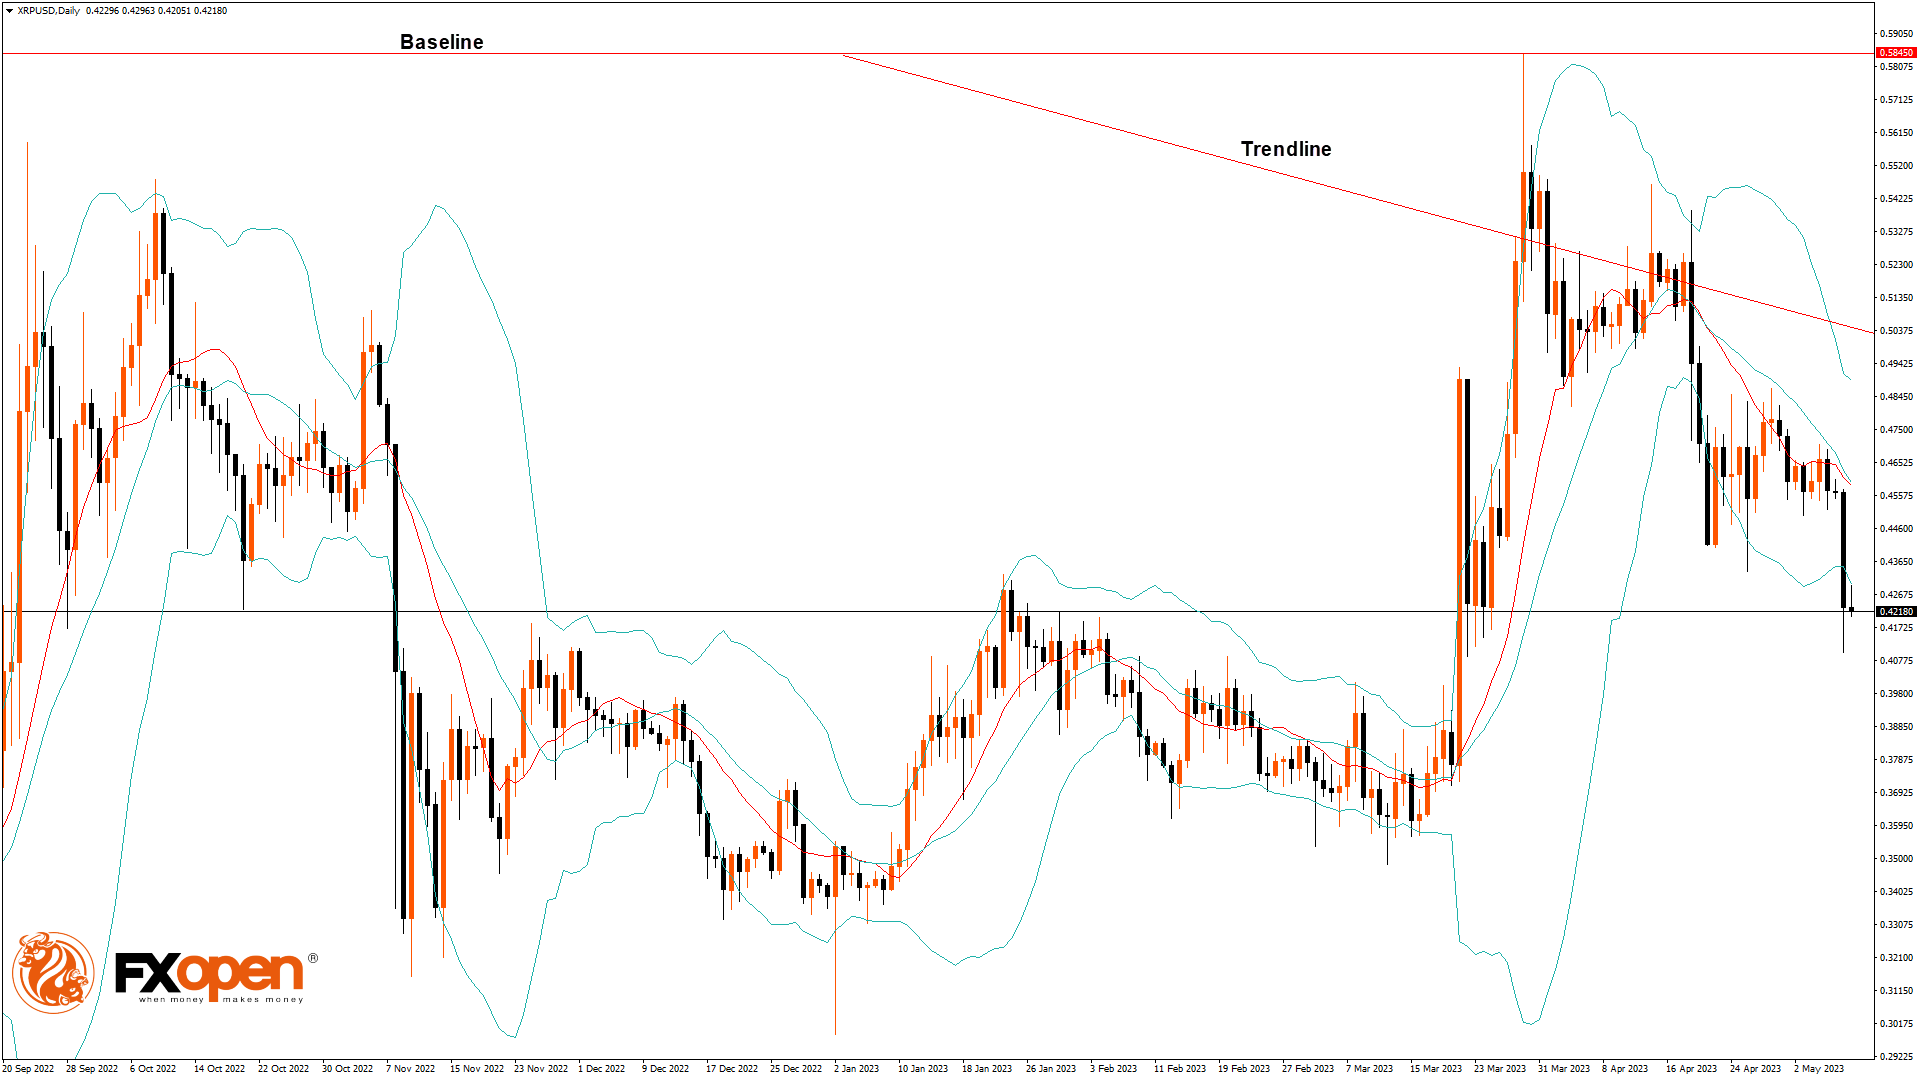
The price of Ripple continues its bearish momentum and remains in a downtrend as confirmed by the major technical indicators and moving averages. The next visible targets are located at $0.4000 and $0.3800.
Now, the Ripple prices have entered the consolidation zone, and a mild bearish momentum is visible on the daily timeframe.
The resistance level is located at $0.4594, at which the price crosses 9 day moving average.
We can see a continuous progression of a bearish trend line formation from $0.4706 to $0.4103.
The support level is located at $0.4035, which is 3-10 day MACD oscillator stalls, and at $0.4015, which is a 38.2% retracement from 52 week low.
The weekly outlook for Ripple is $0.3800 with a consolidation zone of $0.4000.
This article represents the opinion of the Companies operating under the FXOpen brand only. It is not to be construed as an offer, solicitation, or recommendation with respect to products and services provided by the Companies operating under the FXOpen brand, nor is it to be considered financial advice.
This article represents the opinion of the Companies operating under the FXOpen brand only. It is not to be construed as an offer, solicitation, or recommendation with respect to products and services provided by the Companies operating under the FXOpen brand, nor is it to be considered financial advice.
Stay ahead of the market!
Subscribe now to our mailing list and receive the latest market news and insights delivered directly to your inbox.

Latest articles

AUD/CAD: Months of Indecision — Is a Breakout Finally Coming?
The Australian dollar has clawed back most of its end-of-June losses, when it touched three-month lows against the greenback amid escalating Middle East tensions. Since then, sentiment has improved: the RBA's Assistant Governor Sarah Hunter signalled the board stands ready

USD/JPY: Battling at the Top of the Triangle
On 3 July, Japan's Finance Minister, Satsuki Katayama, stated that the Ministry of Finance remains in close contact with US authorities regarding developments in USD/JPY as the yen traded near its weakest level in almost 40 years. Similar verbal

Dow Jones (DJIA): Consolidation Beyond the Trend
Federal Reserve Chair Kevin Warsh testified before Congress on 14–15 July, reaffirming the Fed's commitment to bringing inflation back to target while providing no clear guidance on the future path of interest rates. Meanwhile, June inflation data came in