


NZDUSD Looks Set For Major Slump As Bearish Pin Bar Emerges
FXOpen
The New Zealand Dollar (NZD) extended upside movement against the US Dollar (USD) on Friday, increasing the price of NZDUSD to more than 1.7560 following the release of some key economic news. The technical bias still remains bearish in the long run due to a Lower Low on the daily chart.
Technical Analysis
As of this writing, the pair is being traded near 0.7552. A hurdle can be seen around 0.7613, the confluence of bearish pin bar, trendline resistance as well as 61.8% fib level as demonstrated in the following chart. A break and daily closing above the 0.7613 could incite renewed buying interest, validating a move towards the 0.7700 handle.
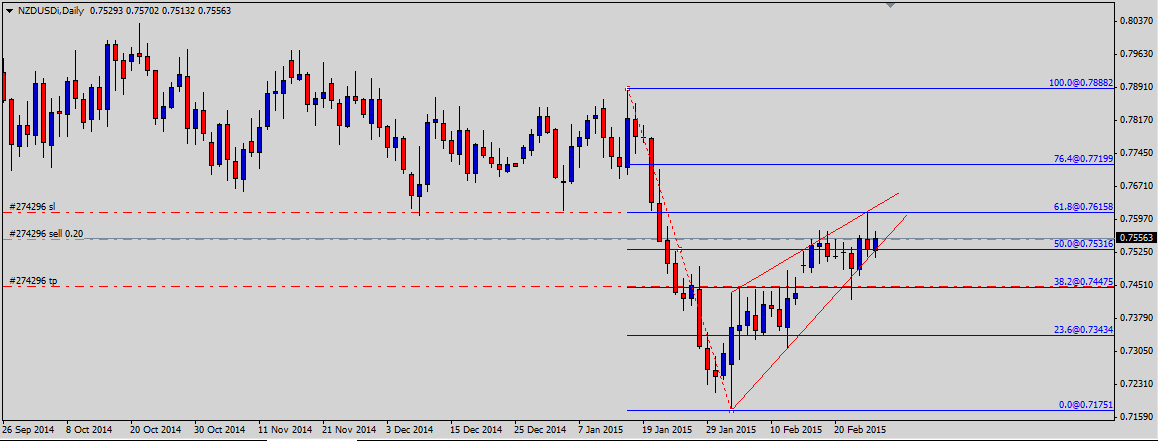
On the downside, the pair is expected to find a support around 0.7509, the lower trendline channel ahead of 0.7447, the 38.2% fib level. The technical bias will remain bearish as long as the 0.7712 resistance area is intact.
New Zealand Building Permits
The building permits in New Zealand remained -3.8% in January as compared to -2.1% in the month before, down beating the average forecast of 3.0%, a government report revealed today. Generally speaking, higher building permits are considered positive for the economy thus a worse than expected actual outcome spurred renewed selling pressure in the price of NZDUSD.
Trade Idea
Considering the overall technical and fundamental outlook, selling the Kiwi dollar around the current levels appears to be a good strategy in short to medium term. The trade should be stopped out at 0.7613 while the target may be 0.7450 with a risk/reward ratio of 1:2. The selling pressure may be increased on a breakout through the rising wedge formation as demonstrated in the above daily chart.
Trade over 50 forex markets 24 hours a day with FXOpen. Take advantage of low commissions, deep liquidity, and spreads from 0.0 pips (additional fees may apply). Open your FXOpen account now or learn more about trading forex with FXOpen.
This article represents the opinion of the Companies operating under the FXOpen brand only. It is not to be construed as an offer, solicitation, or recommendation with respect to products and services provided by the Companies operating under the FXOpen brand, nor is it to be considered financial advice.
Stay ahead of the market!
Subscribe now to our mailing list and receive the latest market news and insights delivered directly to your inbox.


Latest articles

Weekly Market Insights with Gary Thomson: The Week of Central Banks and Earnings
In this video, we’ll explore the key economic events and market trends, shaping the financial landscape. Get ready for insights into financial markets to help you navigate the week ahead. Let’s dive in!
In this episode of Market

Intel at a Crossroads: Earnings Beat Meets Technical Resistance
Intel has just delivered its strongest quarter in over fifteen years, and the market reaction says it all. Q2 2026 revenue surged 25% year-over-year to $16.1 billion, crushing the consensus estimate of $14.42 billion, while adjusted EPS of

Tesla: Complex Range Structure Breaks Down Following Quarterly Earnings
Tesla released its Q2 2026 results after the market closed on 22 July. Revenue increased 26% year-on-year to $28.24 billion, while vehicle deliveries reached a record 480,126 units. However, operating margin fell sharply to 1.4%, down from