


FXOpen
The New Zealand Dollar (NZD) extended downside movement against the greenback yesterday, dragging the NZD/USD to less than 0.8480 amid US growth optimism and Reserve Bank of New Zealand (RBNZ) monetary policy outlook. The sentiment also turns to bearish due to Lower Low (LL) on the daily chart. The pair is however approaching a key support area where huge buying interest may be noted.
Technical Analysis
As of this writing, the pair is being traded near 0.8486. A hurdle can be noted around 0.8504, the 38.2% fib level ahead of 0.8571, the intraday high of yesterday as demonstrated in the following chart. A break above 0.8571 will expose 0.8778 in the long run which is the swing high of the last major rally.
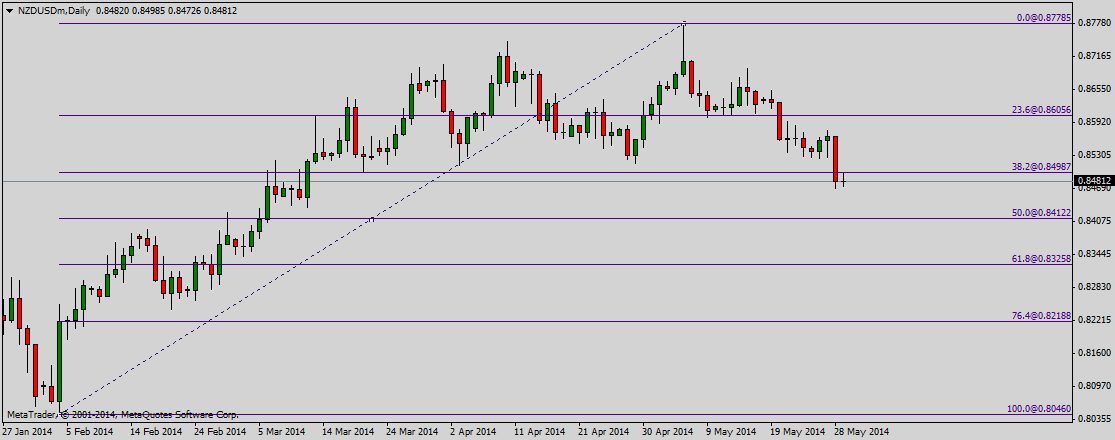
On the downside, the pair is likely to find a support near 0.8419, the 50% fib level. A bullish reversal from the 0.8419 support area appears to be the most likely scenario, however if the RBNZ announces a cut in the benchmark interest rate then the pair might go for a deeper correction below the 0.8400 handle.
New Zealand Building Permits
Statistics New Zealand will release the Building Permits report on Friday (tomorrow). According to the average forecast of various analysts, the building permits declined by 5% in April as compared to 8.3% increase in the month before, better than expected actual outcome will be seen as bullish for NZD/USD and vice versa. Generally speaking, higher building permits are seen as positive for the economy as they signal boom in the housing sector.
Conclusion
Keeping in view the overall fundamental and technical outlook, buying the pair near the 50% fib support area appears to be a good strategy, the trade should however be stopped out on a daily closing below the support level as described above.
Trade over 50 forex markets 24 hours a day with FXOpen. Take advantage of low commissions, deep liquidity, and spreads from 0.0 pips. Open your FXOpen account now or learn more about trading forex with FXOpen.
This article represents the opinion of the Companies operating under the FXOpen brand only. It is not to be construed as an offer, solicitation, or recommendation with respect to products and services provided by the Companies operating under the FXOpen brand, nor is it to be considered financial advice.
Stay ahead of the market!
Subscribe now to our mailing list and receive the latest market news and insights delivered directly to your inbox.

Latest from Forex Analysis
Latest articles

Weekly Market Wrap With Gary Thomson: Nasdaq, EUR/USD, USD/CHF, Brent Crude Oil, Googl Shares
Get the latest scoop on the week's hottest headlines, all in one convenient video. Join Gary Thomson, the COO of FXOpen UK, as he breaks down the most significant news reports and shares his expert insights.
- Nasdaq Composite: Worst Session

Analysis of AUD/USD: Exchange Rate Falls to Early May Low
As indicated by the 4-hour AUD/USD chart today:
→ the rate fell below 0.652, a level last seen on May 2;
→ the RSI indicator dropped below 15, a level last seen during the panic over the spread of COVID-19

Analysis of AMZN Stock: Price at 1.5-Month Low
As shown in the AMZN chart, the stock price dropped below:
→ the psychological level of $180;
→ the mid-June interim low.
The last time AMZN traded below $180 was in early June.
Thus, AMZN has faced sell-offs, similar to other tech