


A Weak Dollar Is the Driver of Price Records for NASDAQ-100, BTC/USD, XAU/USD
FXOpen

Financial market participants expect an easing of the Fed's monetary policy. The prospect of lower rates puts pressure on the value of the dollar, which in turn pushes up dollar-denominated assets. This contributed to the setting of record highs:
→ The price of BTC/USD exceeded 70k dollars per bitcoin
→ The price of XAU/USD exceeded USD 2,200 per ounce of gold
→ The NASDAQ-100 index reached 18,400 points.
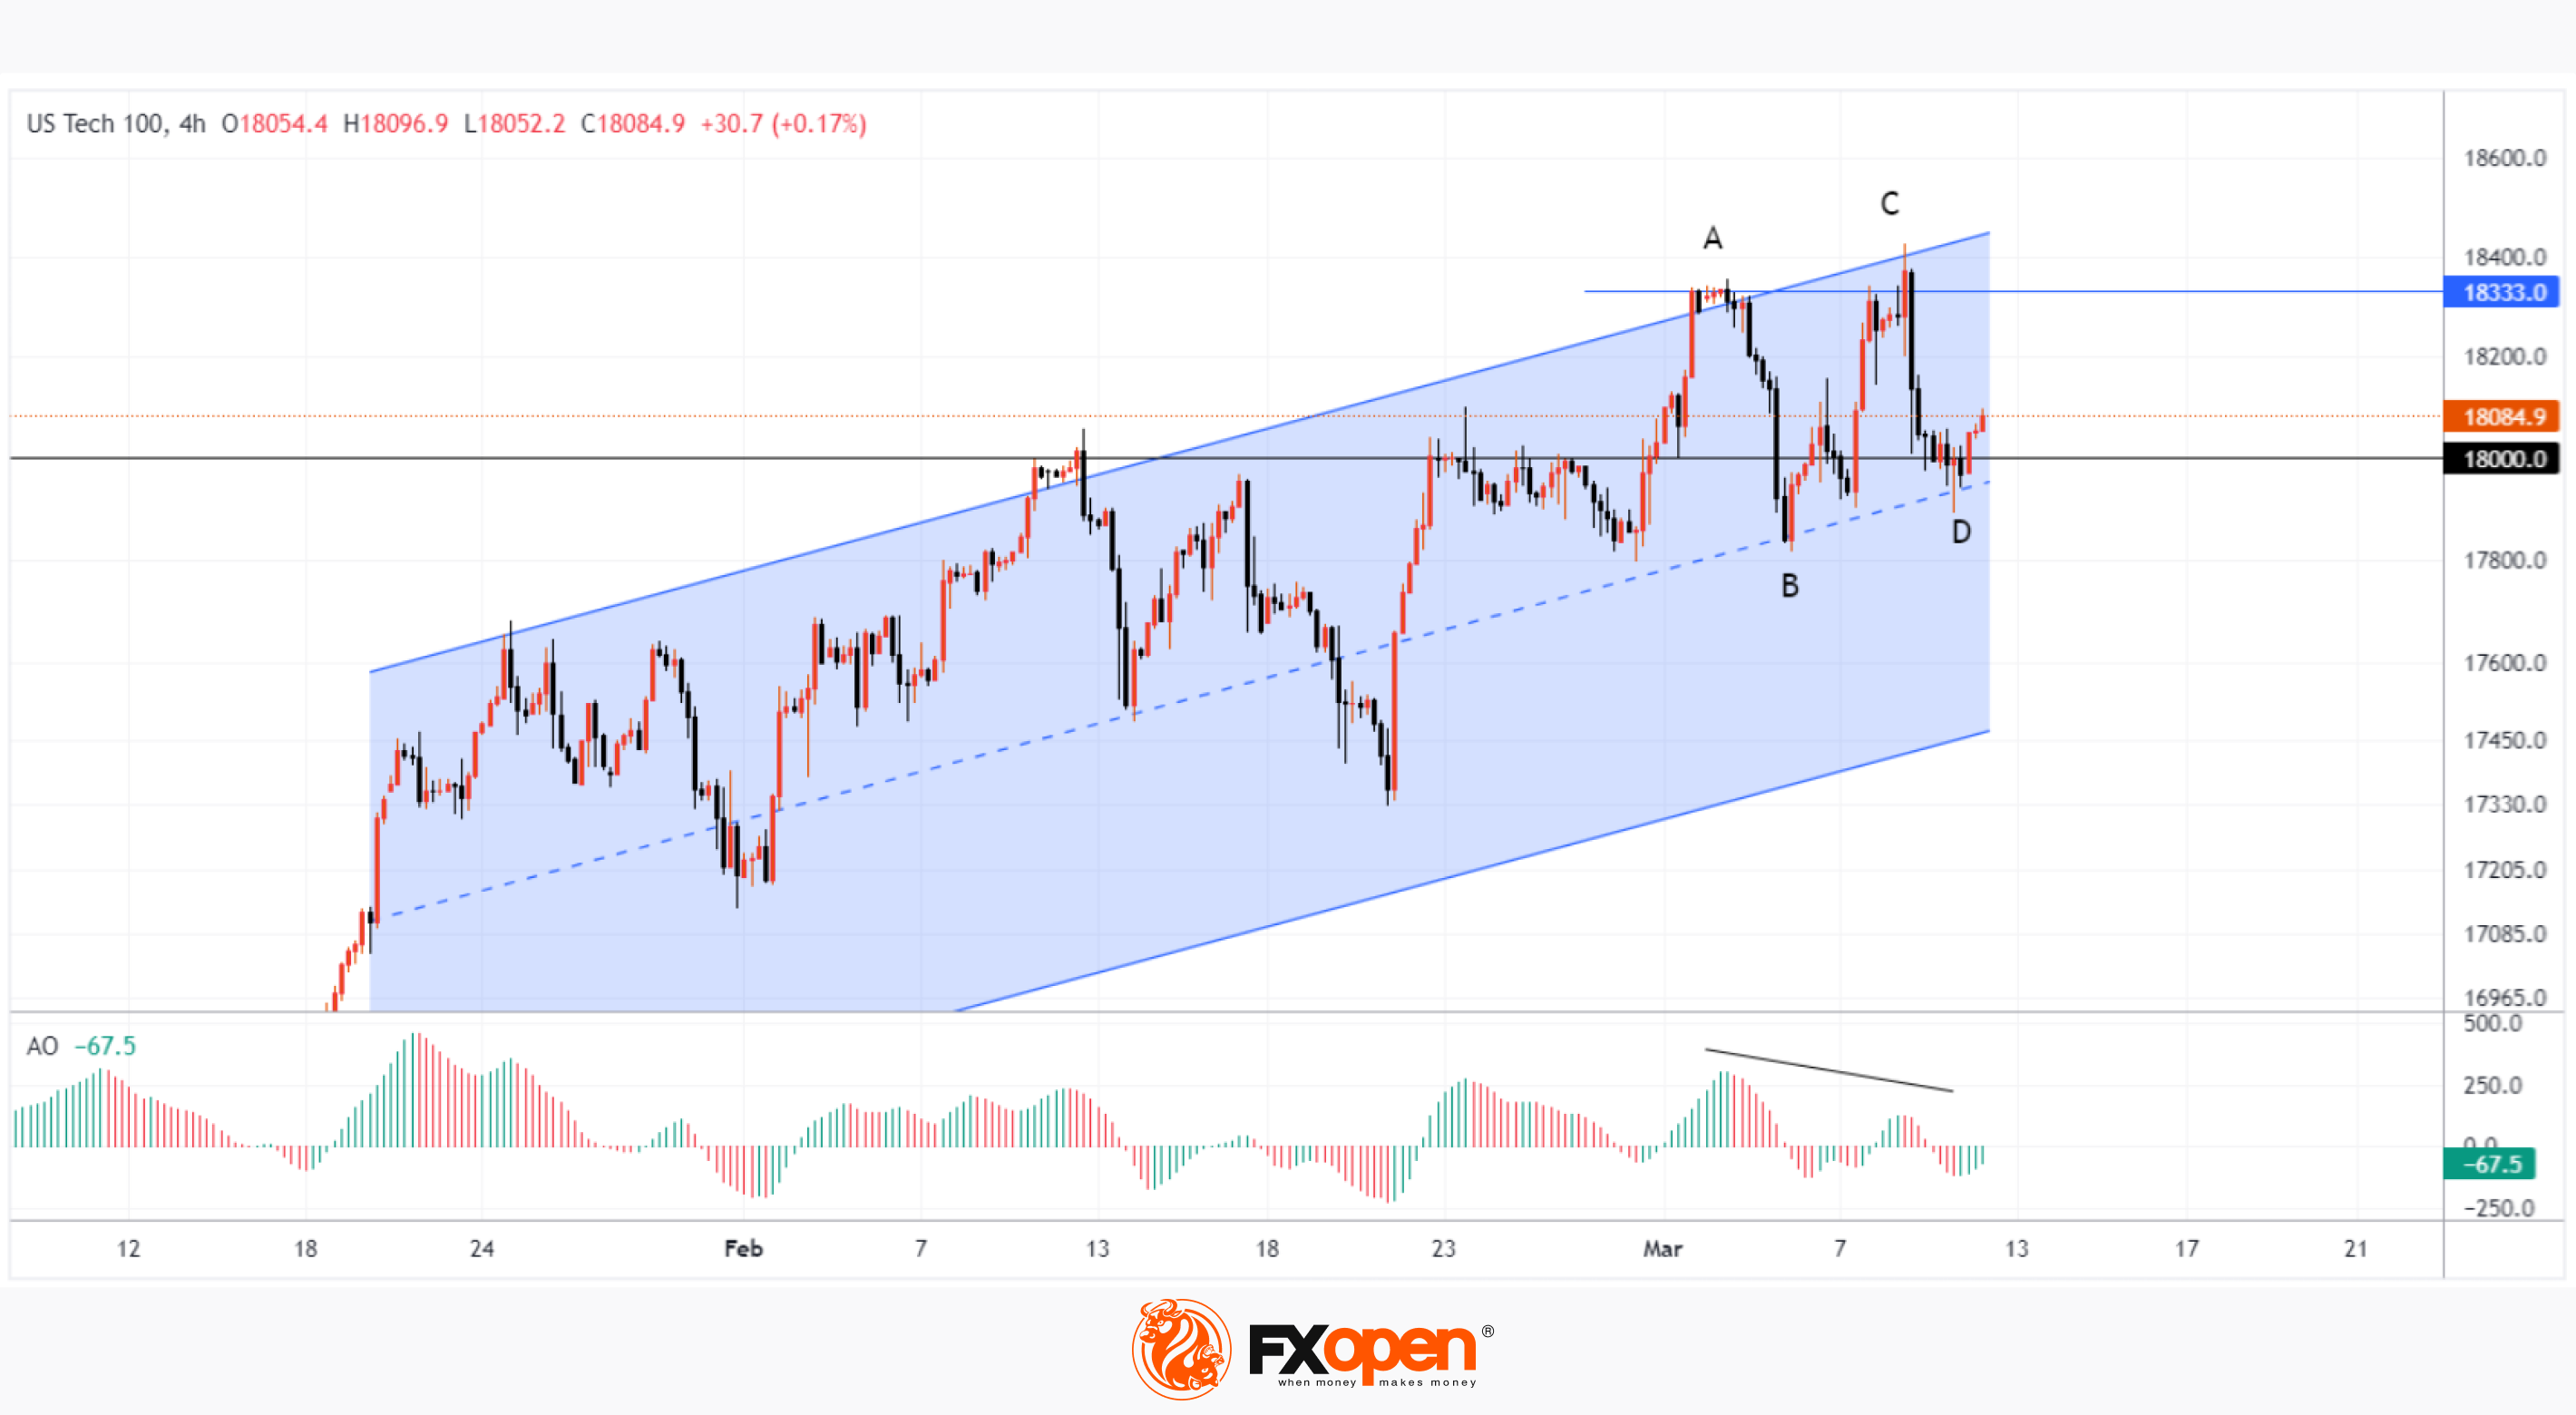
But are markets too optimistic? Let's see what the technical analysis of the NASDAQ-100 chart shows today:
→ The price is in an uptrend (shown in blue), which has been in effect since the beginning of the year. The price is in the upper half, which may indicate the strength of demand.
→ Top C only slightly exceeded the level of the previous top A. It is not surprising that a bearish divergence has formed on the oscillators — Awesome Osc among them. Buyers who entered long positions at the breakout of top A found themselves in a trap. Sellers who held stops above A lost their positions.
Pay attention to the nature of the NASDAQ-100 price movement from tops to local lows A→B and C→D. Each time, the bears were able to quickly lower the price as soon as it exceeded the 18.333 level. This indicates that sellers are active — perhaps they are taking profits after the rally since the beginning of the year.
One way or another, the level of 18.333 looks like an important resistance. So far, the price of NASDAQ-100 is at support from the median line of the channel, but it is possible, given the signs of exhaustion of demand and the activity of sellers, that the price may fall to its lower border, forming a correction. This may happen under the influence of news — today, be prepared, at 15:30 GMT+3 data on inflation in the United States will be published.
Trade global index CFDs with zero commission and tight spreads (additional fees may apply). Open your FXOpen account now or learn more about trading index CFDs with FXOpen.
This article represents the opinion of the Companies operating under the FXOpen brand only. It is not to be construed as an offer, solicitation, or recommendation with respect to products and services provided by the Companies operating under the FXOpen brand, nor is it to be considered financial advice.
Stay ahead of the market!
Subscribe now to our mailing list and receive the latest market news and insights delivered directly to your inbox.


Latest articles

Ethereum: Has the Recovery Begun?
Ethereum has staged a notable rebound after once again testing the heavily watched psychological zone around 1500$. Since bouncing off this support, ETH/USD has climbed roughly 13%, now trading around the $1,700 mark.
This recovery is being driven

Oil Prices Are Back at Pre-Conflict Levels. Analysts Are Divided
At the start of May, oil markets were still pricing in elevated geopolitical risk and expectations of sustained supply disruption.
But easing tensions between Washington and Tehran, along with improving supply expectations, have rapidly shifted sentiment back toward fundamentals.
📉 Brent

The Dollar Awaits the Week’s Key Report: AUD/USD and NZD/USD at Crucial Technical Levels
Following mixed performance by the US dollar earlier this week, investors are now fully focused on the June Nonfarm Payrolls report, which will be released on Thursday rather than Friday. The schedule has been brought forward as US financial markets