


AAPL Share Price Falls 3% After Report
FXOpen

After the close of yesterday's trading session, the once first-largest company by capitalization, Apple, reported on its activities for the 4th quarter of 2023. The actual numbers exceeded expectations:
→ revenue: actual = USD 119.5 billion (expected = USD 117.9 billion);
→ earnings per share: actual = USD 2.3 (expected = USD 1.99).
It would seem that things were going well, but this was due to the holiday period and the traditional seasonal increase in purchases of Apple products. In the future, analysts can expect a decrease in revenue, as was the case in 2023.
Confirming this possibility, Apple gave weak guidance for the next quarter given the decline in demand in China.
As a result, in post-market trading, AAPL's share price fell approximately 3% to the support level (shown by the black line) drawn near this year's lows.
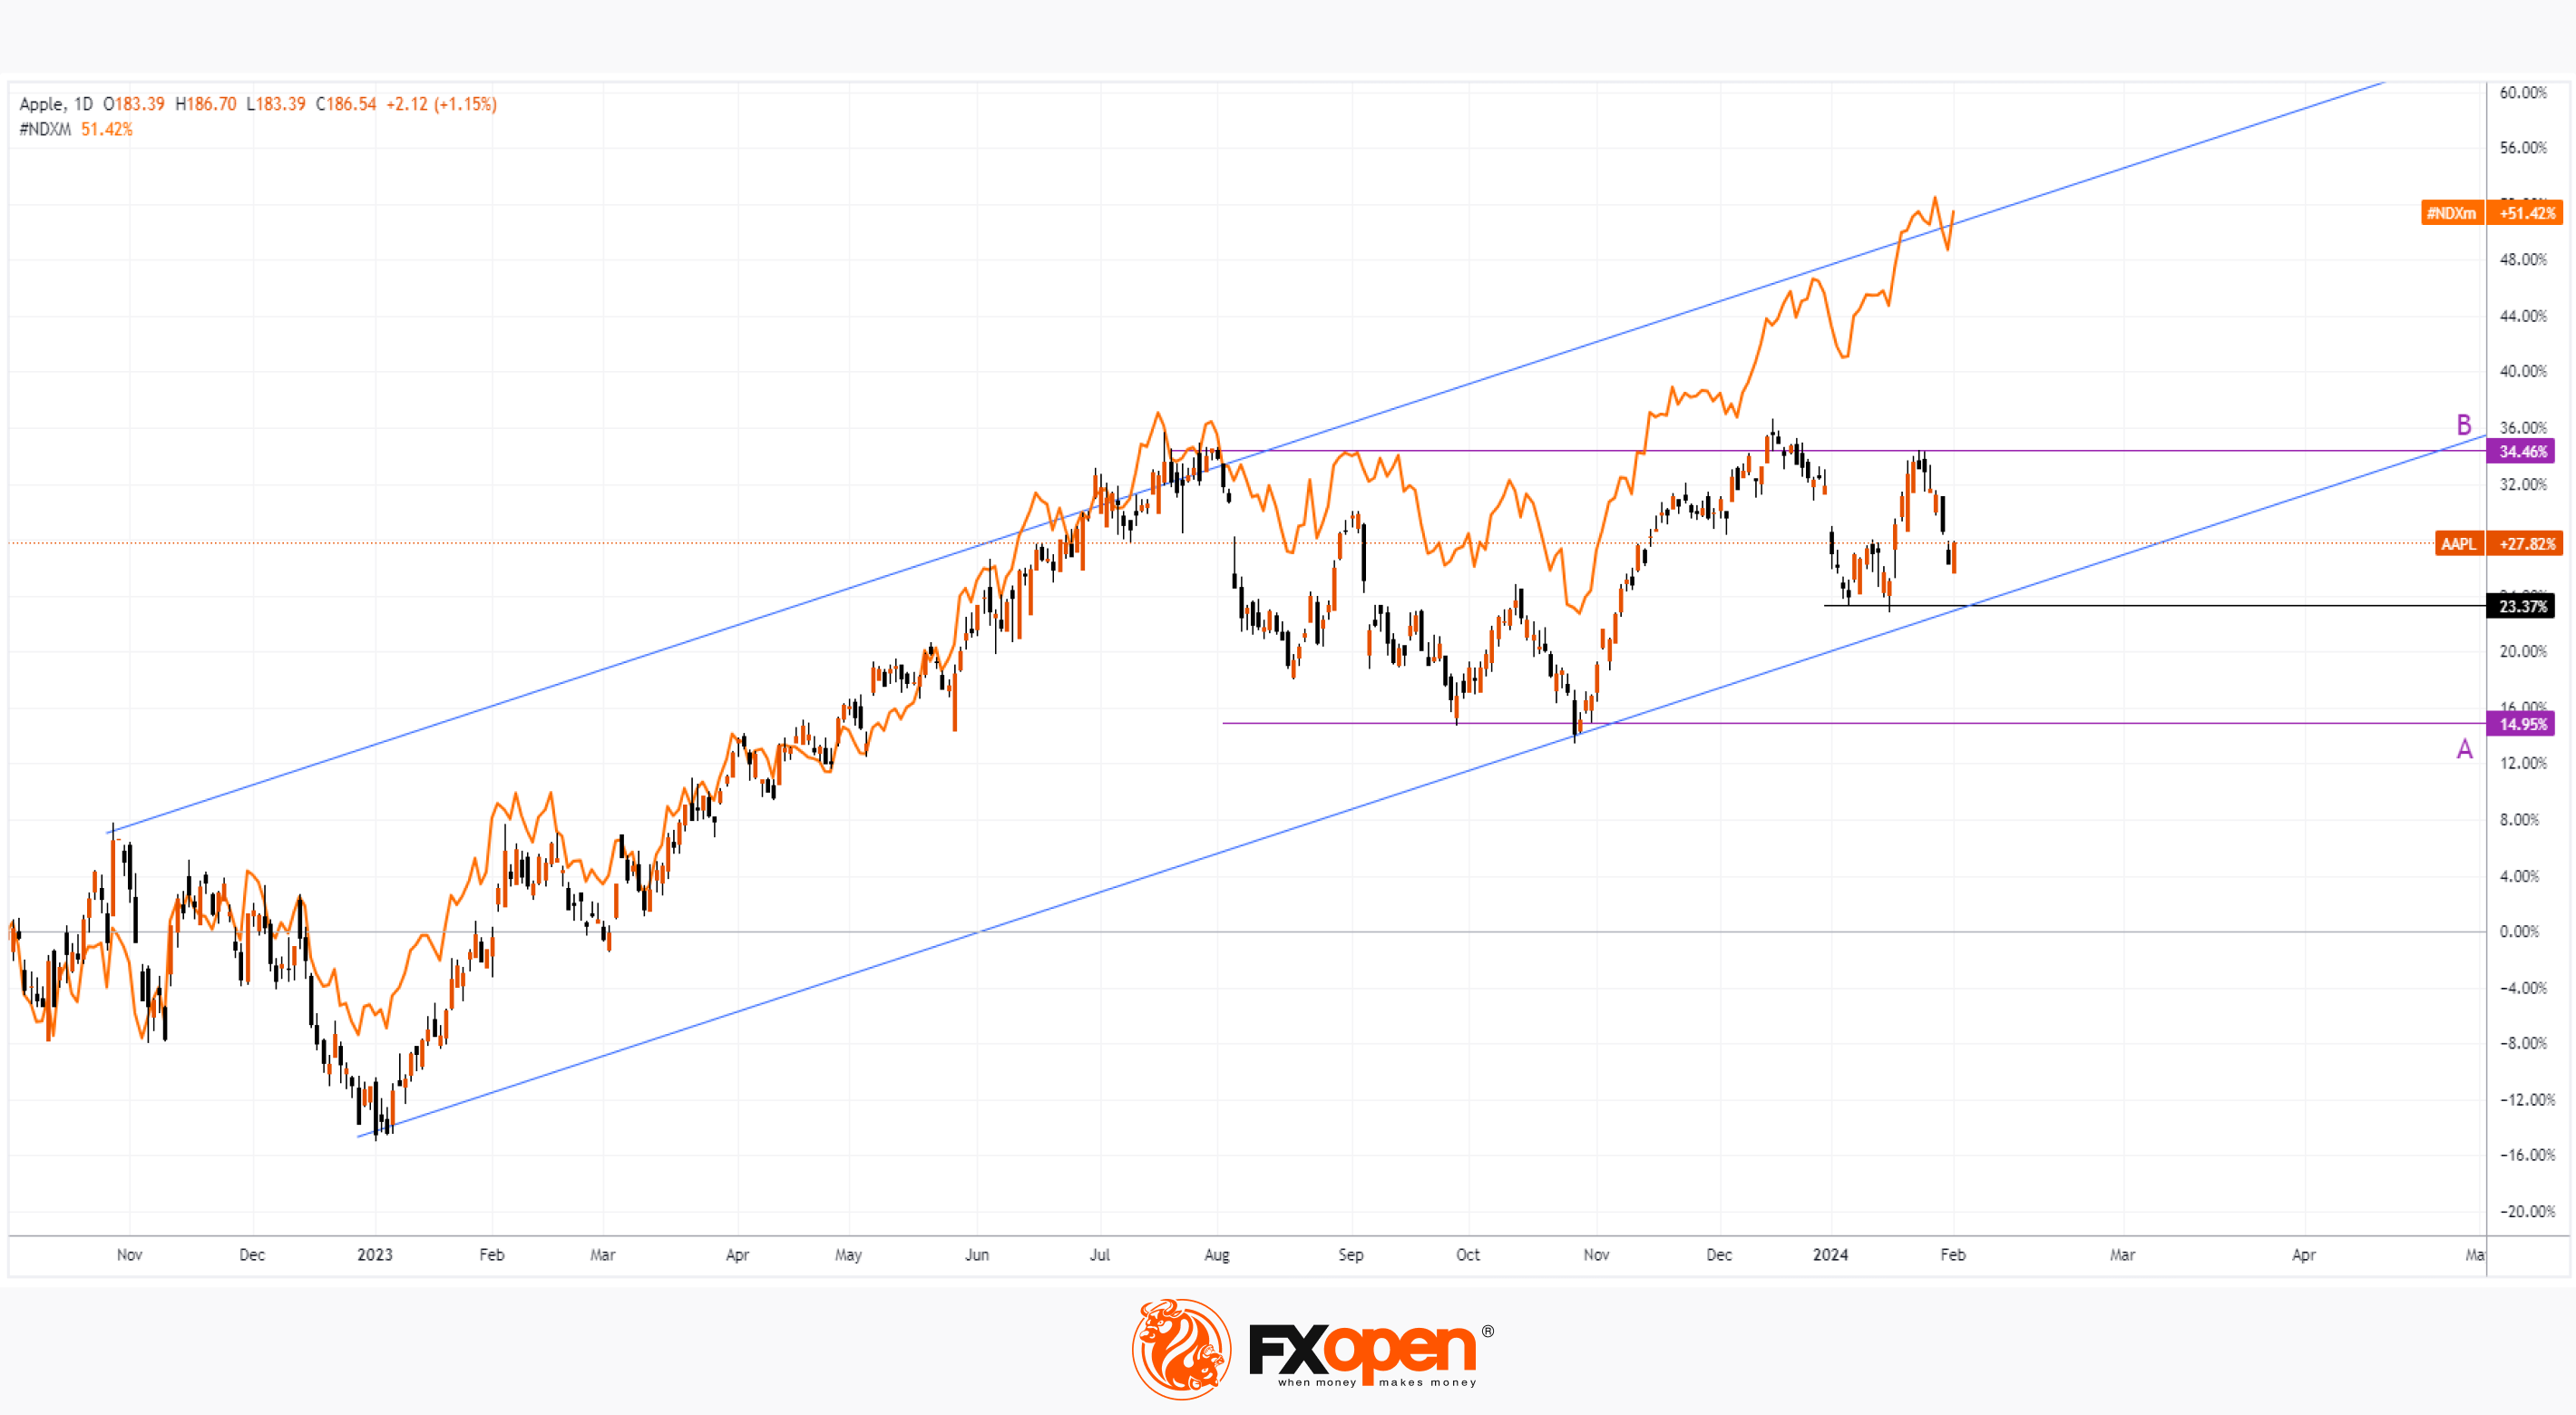
The AAPL stock chart today shows that:
→ level A looks like an important resistance: the price cannot overcome it in order to move up along with the index;
→ a new threat of a bearish breakdown of the lower blue trend line has emerged - if it happens, the bears may try to test the important low of autumn 2023 (level B).
While the picture looks flat, given that AAPL's share price has been in an A-B range since the middle of last year, the situation could be potentially bearish given that the price cannot rise in a bull market.
Investors' hopes may be associated with the presentation of the Vision Pro headset, as well as with achievements related to the introduction of AI. As Tim Cook said, the company has “a lot of internal work going on,” but Apple is not revealing details yet so as not to “come to the forefront.”
Buy and sell stocks of the world's biggest publicly-listed companies with CFDs on FXOpen’s trading platform. Open your FXOpen account now or learn more about trading share CFDs with FXOpen.
This article represents the opinion of the Companies operating under the FXOpen brand only. It is not to be construed as an offer, solicitation, or recommendation with respect to products and services provided by the Companies operating under the FXOpen brand, nor is it to be considered financial advice.
Stay ahead of the market!
Subscribe now to our mailing list and receive the latest market news and insights delivered directly to your inbox.


Latest articles

Ethereum: Has the Recovery Begun?
Ethereum has staged a notable rebound after once again testing the heavily watched psychological zone around 1500$. Since bouncing off this support, ETH/USD has climbed roughly 13%, now trading around the $1,700 mark.
This recovery is being driven

Oil Prices Are Back at Pre-Conflict Levels. Analysts Are Divided
At the start of May, oil markets were still pricing in elevated geopolitical risk and expectations of sustained supply disruption.
But easing tensions between Washington and Tehran, along with improving supply expectations, have rapidly shifted sentiment back toward fundamentals.
📉 Brent

The Dollar Awaits the Week’s Key Report: AUD/USD and NZD/USD at Crucial Technical Levels
Following mixed performance by the US dollar earlier this week, investors are now fully focused on the June Nonfarm Payrolls report, which will be released on Thursday rather than Friday. The schedule has been brought forward as US financial markets