


FXOpen

Yesterday, 10 June, at the WWDC2024 conference, the American corporation Apple unveiled its new artificial intelligence system, Apple Intelligence (AI).
Apple Intelligence will allow users to enhance their text and communicate more effectively: rewriting, proofreading, and summarising text almost everywhere, including in mail, notes, pages, and third-party applications. The Rewrite function will enable changing the tone of messages, adding jokes, and rephrasing sentences.
Key features include:
→ AI's capability to understand the user's "personal context."
→ AI's ability to generate unique photos, sketches, and illustrations in Notes, Freeform, and Pages.
→ Apple confirmed its collaboration with OpenAI during the presentation.
However, on the same day, AAPL shares fell nearly 2%, with high trading volumes on the Nasdaq—over 97 million shares were traded, compared to an average volume of about 59 million.
Is this a sign that investors were disappointed with the presentation? Looking at AAPL’s stock chart today, it suggests that the decline might be due to the significant $195 level per AAPL share.
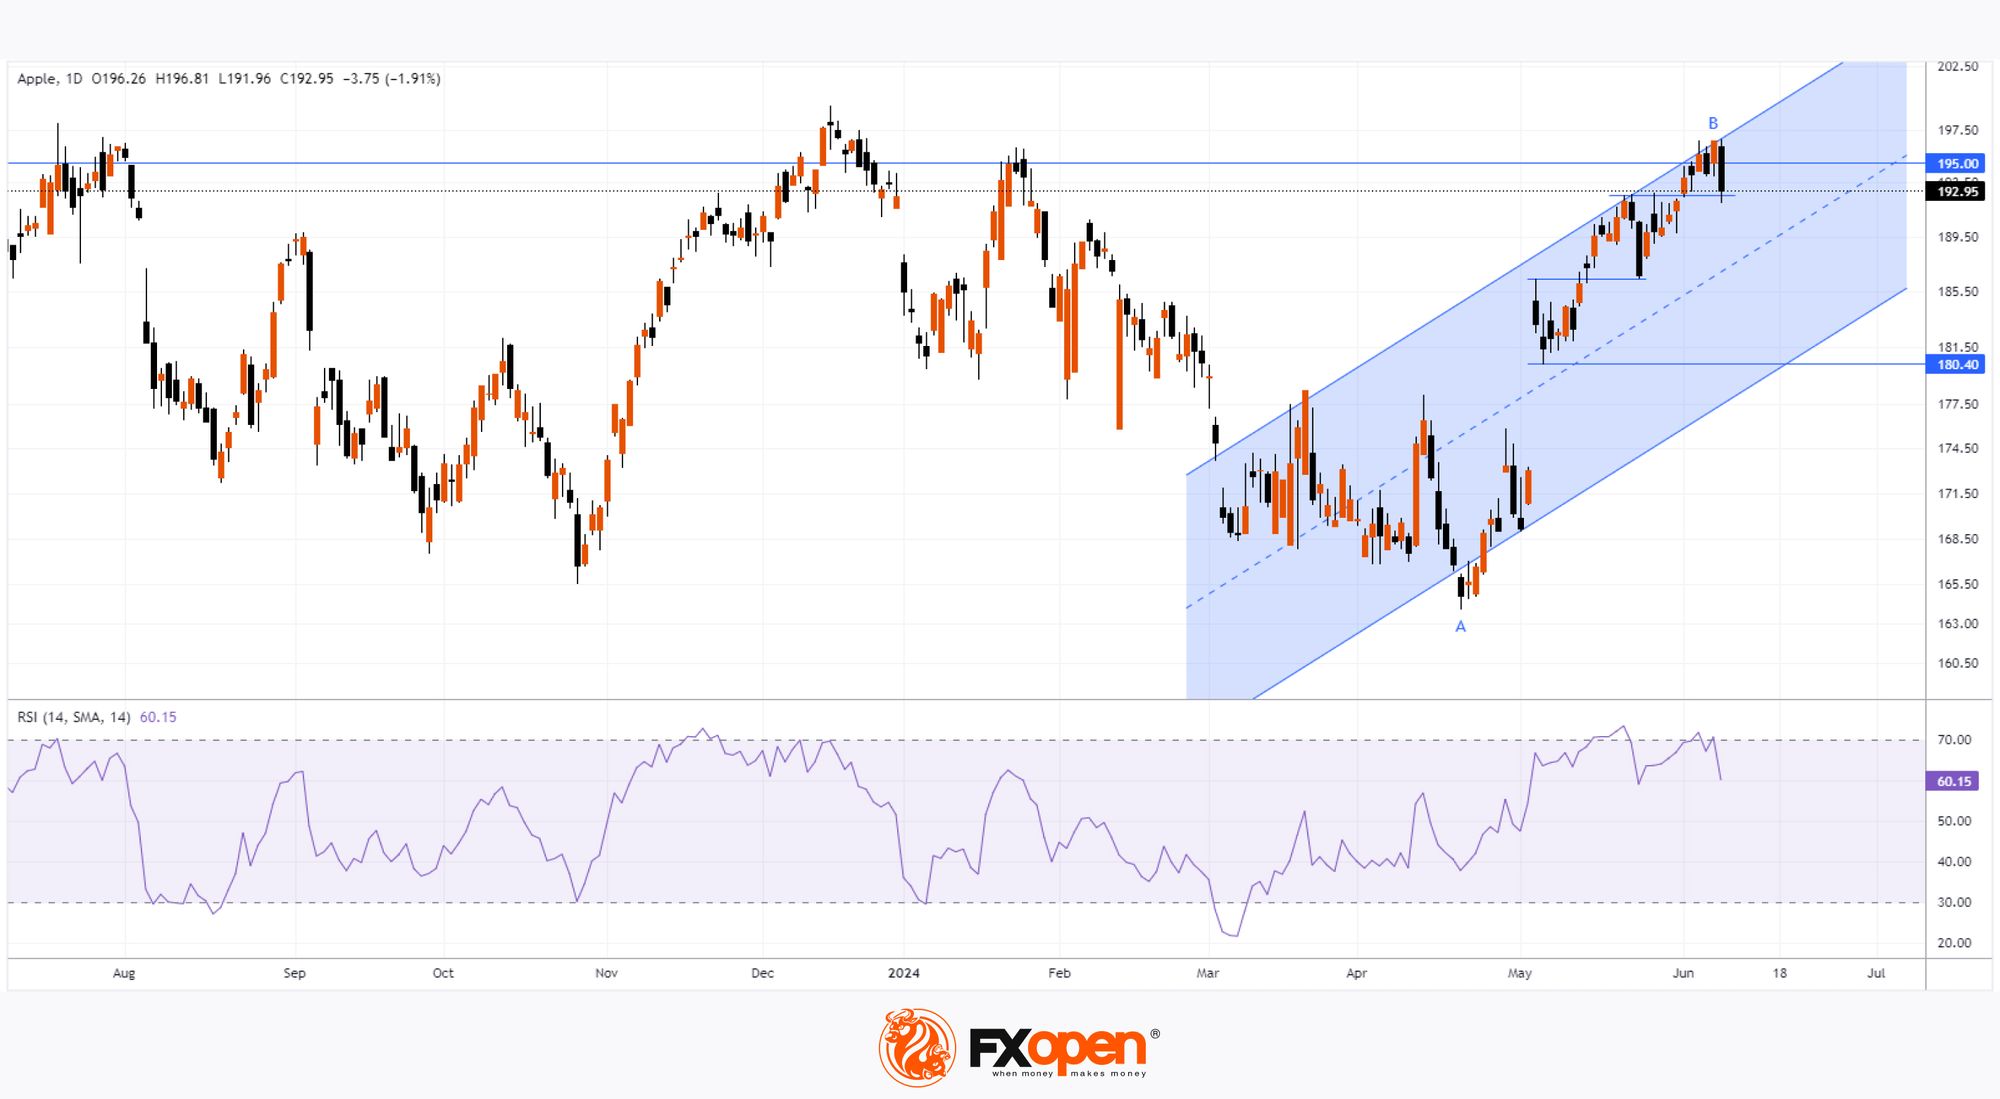
Technical analysis of AAPL’s chart shows that:
→ The price attempted to hold above $195 three times (end of July 2023, December 2023, end of January 2024) but failed. The proximity to the crucial psychological mark of $200 per share seems to be a factor.
→ The RSI indicator is near the overbought zone, motivating a price correction and profit-taking near key resistance (after a rally from A to B of almost 20% in less than two months)—this could have driven yesterday’s decline.
→ Yesterday’s candle formed a bearish engulfing pattern.
If the correction continues, AAPL’s price may fall within the ascending channel (shown in blue) to its lower boundary. A key support level might be around $180.40:
→ Approximately the 50% Fibonacci retracement level from the bullish impulse A to B.
→ The upper boundary of the bullish gap from early May.
Buy and sell stocks of the world's biggest publicly-listed companies with CFDs on FXOpen’s trading platform. Open your FXOpen account now or learn more about trading share CFDs with FXOpen.
This article represents the opinion of the Companies operating under the FXOpen brand only. It is not to be construed as an offer, solicitation, or recommendation with respect to products and services provided by the Companies operating under the FXOpen brand, nor is it to be considered financial advice.
Stay ahead of the market!
Subscribe now to our mailing list and receive the latest market news and insights delivered directly to your inbox.


Latest articles

European Currencies Decline: Pound Hits New Lows, Euro Under Pressure
European currencies continue to weaken against the US dollar amid rising geopolitical tensions and increased demand for safe-haven and liquid assets. Market participants are reducing exposure to riskier instruments, putting pressure on both the euro and the pound. Additional support

Market Analysis: GBP/USD Dips Further As EUR/GBP Regains Traction
GBP/USD failed to climb above 1.3500 and corrected some gains. EUR/GBP started a decent increase and might aim for more gains above 0.8700.
Important Takeaways for GBP/USD and EUR/GBP Analysis Today
· The British Pound
