


FXOpen
Chinese e-commerce giant Alibaba has unveiled an upgraded version of its artificial intelligence model, Qwen2.5 Max. According to the company, the model:
→ Outperforms DeepSeek, the AI model that made headlines this week, in several key areas.
→ Achieves "competitive performance compared to top-tier models," referencing OpenAI and Meta, based on benchmark tests.
The news was met with enthusiasm, driving Alibaba's (BABA) stock price up by more than 6% in a single day, pushing BABA shares to their highest level of the year.
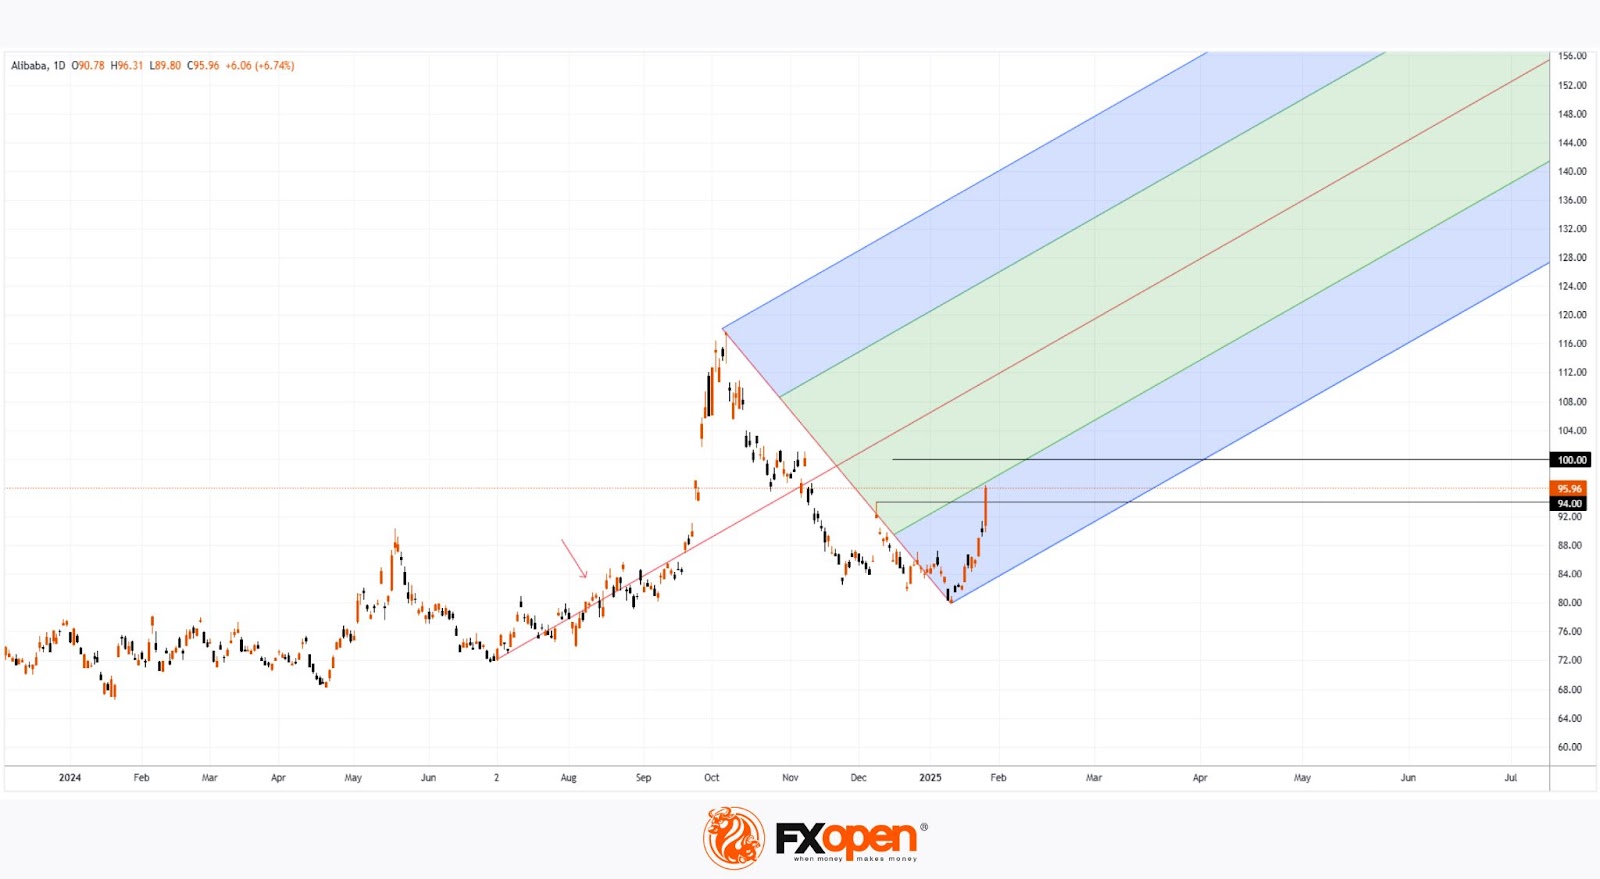
The technical analysis of the BABA stock chart shows that stock fluctuations form reference points for constructing the Andrew’s Pitchfork pattern, while price movements along the central line (indicated by an arrow) confirm the validity of the pattern's construction.
Currently, the price:
→ Has broken above December’s high at around $94.
→ Is approaching the psychological resistance level of $100.
Whether bulls can sustain or extend these gains will largely depend on Alibaba’s Q4 earnings report, set to be released today, 29 January.
According to TipRanks:
→ 11 out of 12 analysts recommend buying BABA stock.
→ The 12-month average price target stands at $121.33.
Buy and sell stocks of the world's biggest publicly-listed companies with CFDs on FXOpen’s trading platform. Open your FXOpen account now or learn more about trading share CFDs with FXOpen.
This article represents the opinion of the Companies operating under the FXOpen brand only. It is not to be construed as an offer, solicitation, or recommendation with respect to products and services provided by the Companies operating under the FXOpen brand, nor is it to be considered financial advice.
Stay ahead of the market!
Subscribe now to our mailing list and receive the latest market news and insights delivered directly to your inbox.


Latest articles

USD/CAD Rises to a Two-Month High
Today, the USD/CAD currency pair climbed above the 1.3787 level for the first time since late January.
→ Demand for the US dollar is being supported by concerns over escalating tensions in the Middle East. Market participants are favouring

Alphabet (GOOGL) Shares Fall to 2026 Low
As the chart shows, Alphabet (GOOGL) shares have dropped to their lowest level of 2026, with trading closing well below the psychological $300 per share mark.
Why Have Alphabet (GOOGL) Shares Declined?
The bearish move is driven by a combination

FX Market Awaits Macro Data: EUR/USD and GBP/USD Near Range Boundaries
European currencies are trading without a clear direction against the US dollar, remaining in a consolidation phase following the earlier decline driven by USD strength. At the start of the week, both EUR/USD and GBP/USD attempted a recovery,