


FXOpen

As the chart indicates, during yesterday’s trading session, shares of Alphabet Inc. (GOOGL), Google’s parent company, climbed to their highest level since July. This surge was driven by market participants' reaction to the company unveiling Willow, a quantum computing chip. According to Google, this chip can perform in less than five minutes computations that would take some of today’s fastest supercomputers 10 septillion years.
“We see Willow as a significant step on our journey towards building a practical quantum computer with real-world applications in areas such as drug discovery, nuclear fusion, battery design, and more,” Google CEO Sundar Pichai stated on X (formerly Twitter) on Monday.
On 22 November, when analysing the price chart of Alphabet Inc. (GOOGL) shares, we:
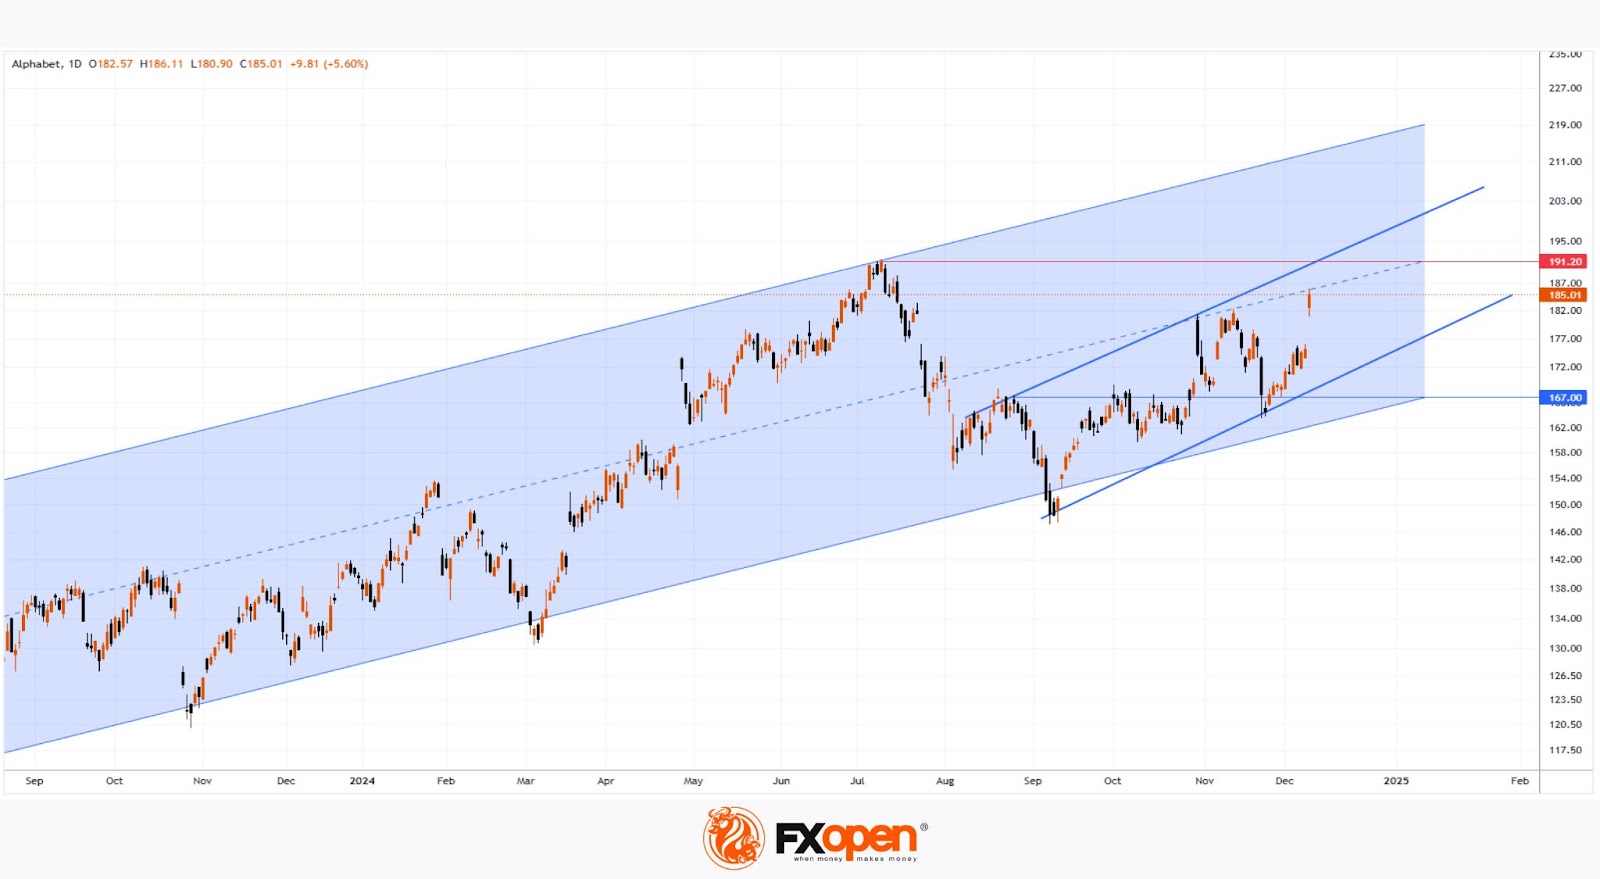
→ Drew an upward channel (marked in blue);
→ Highlighted the support formed at the former resistance level of $167, from which the price rallied to current levels.
What are the potential scenarios for the trend's development?
Technical analysis of Alphabet Inc. (GOOGL) shares suggests:
→ The bullish gap, with a “leap” above the psychological level of $180, could act as future support;
→ The price is near the median of the long-term blue channel, where supply and demand forces often balance out;
→ If the bullish momentum persists, the price could rise to the upper thickened line, which reflects a steeper bullish trajectory.
It’s possible that this upper thickened line, reinforced by the current high near $191.20, will act as significant resistance through the end of 2024, prompting the price to consolidate around the channel's median line.
According to TipRanks surveys:
→ 27 out of 33 analysts recommend buying GOOGL shares;
→ The average 12-month price target for GOOGL shares is $209.
Buy and sell stocks of the world's biggest publicly-listed companies with CFDs on FXOpen’s trading platform. Open your FXOpen account now or learn more about trading share CFDs with FXOpen.
This article represents the opinion of the Companies operating under the FXOpen brand only. It is not to be construed as an offer, solicitation, or recommendation with respect to products and services provided by the Companies operating under the FXOpen brand, nor is it to be considered financial advice.
Stay ahead of the market!
Subscribe now to our mailing list and receive the latest market news and insights delivered directly to your inbox.


Latest articles

Market Analysis: GBP/USD Dips Further As EUR/GBP Regains Traction
GBP/USD failed to climb above 1.3500 and corrected some gains. EUR/GBP started a decent increase and might aim for more gains above 0.8700.
Important Takeaways for GBP/USD and EUR/GBP Analysis Today
· The British Pound


Market Insights with Gary Thomson: Oil, US Retail Sales & NFP in Focus
In this video, we’ll explore the key economic events and market trends, shaping the financial landscape. Get ready for insights into financial markets to help you navigate the week ahead. Let’s dive in!
In this episode of Market