


FXOpen

The earnings season is in full swing: over 200 companies in the S&P 500 index (SPX 500 mini on FXOpen) have reported their current cycle results, with average earnings up 6.5% year-on-year and revenue growth of 4.1%, according to a client note from Oppenheimer Asset Management published on Monday.
This week, investors are awaiting reports from mega-cap companies, including Apple (AAPL), Microsoft (MSFT), Facebook (META), and Amazon.com (AMZN). Among other major brands are Intel (INTC), Boeing (BA), Pfizer (PFE), Exxon Mobil (XOM), as well as chipmaker AMD, whose second-quarter earnings report will be released today after the close of the main trading session.
Analysts expect AMD's earnings per share to rise from $0.62 to $0.68.
What does the AMD chart indicate?
Despite the S&P 500 index (SPX 500 mini on FXOpen) rising approximately 15% in 2024, AMD's share price remains near its January start price.
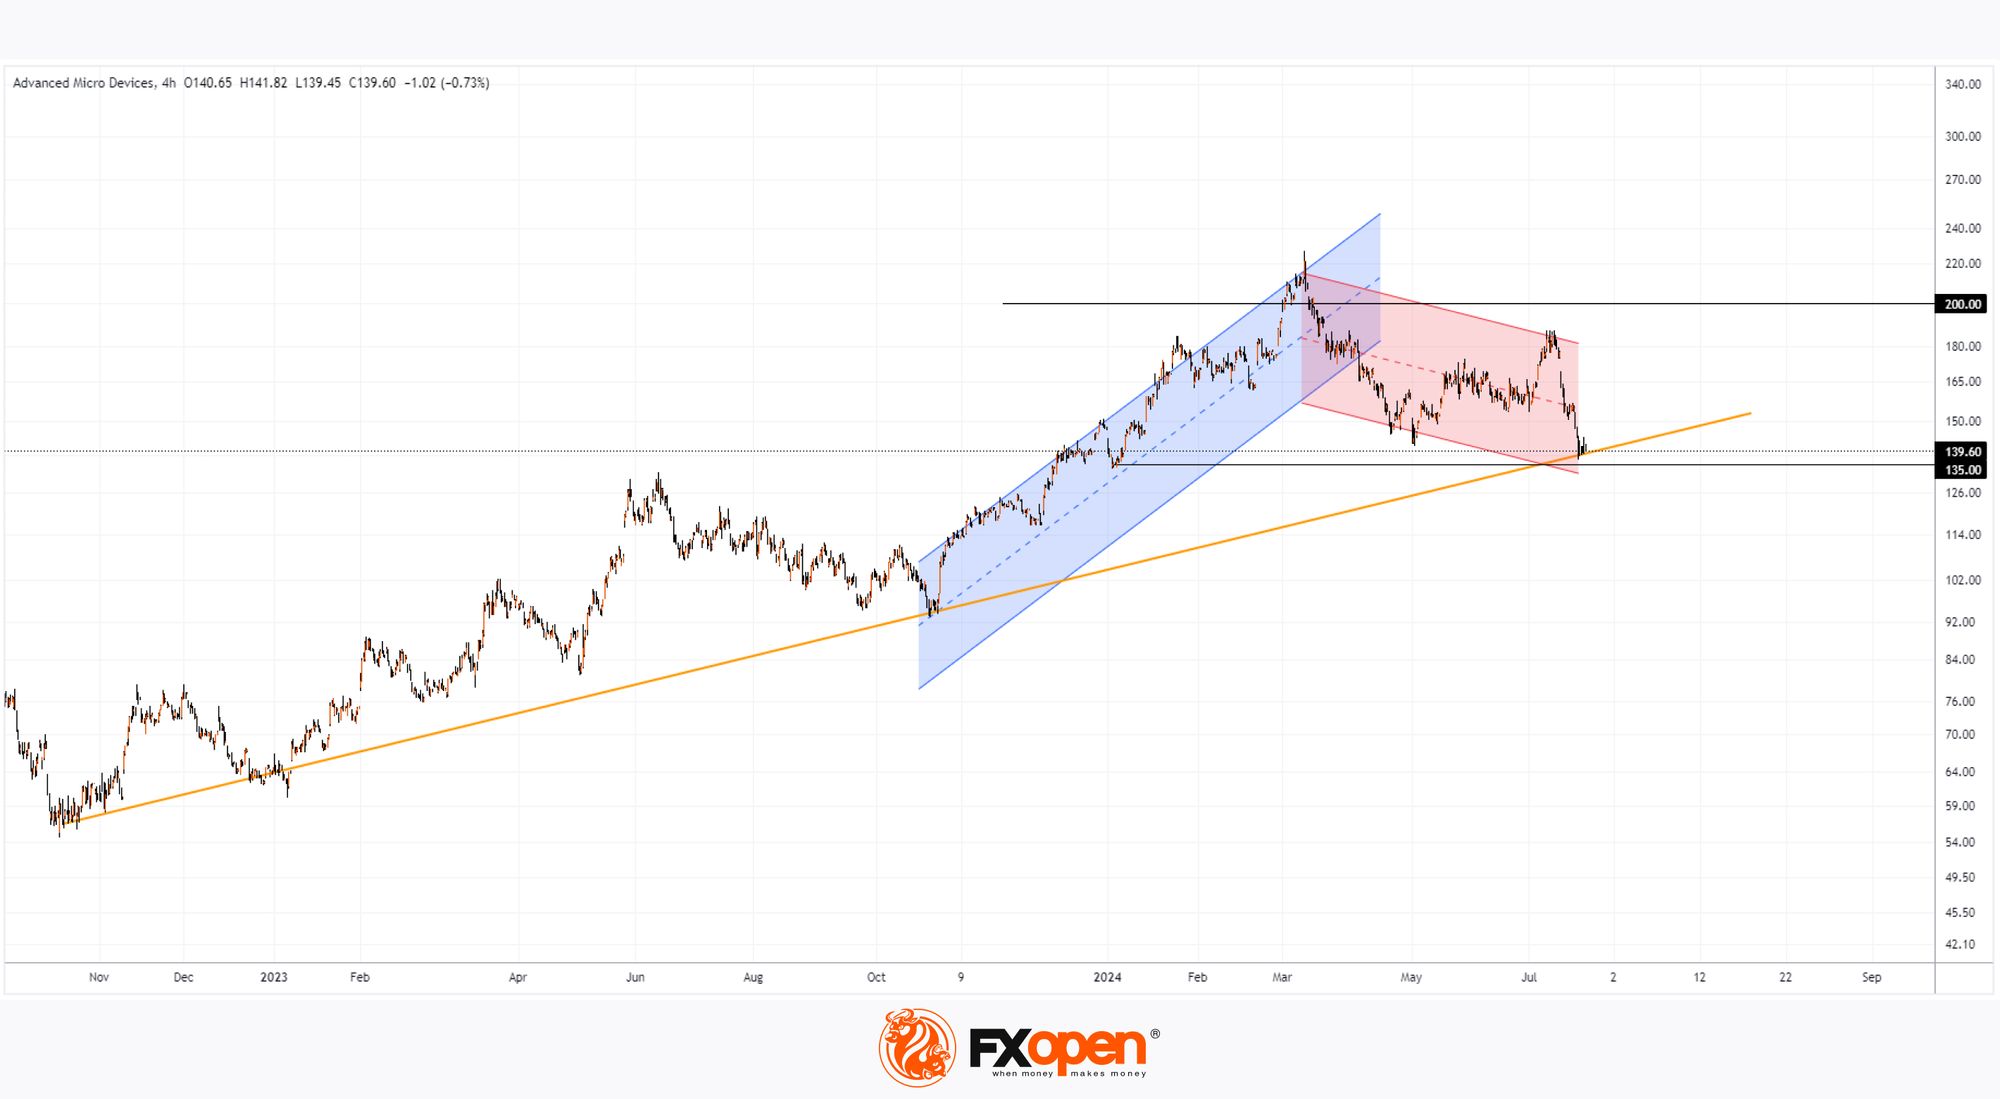
Technical analysis of AMD's share chart shows that the price was in an uptrend (shown in blue) in the first half of 2024, but the trend turned downwards (shown in red) after the price exceeded the psychological level of $200.
Today, AMD's share price is near a support block formed by:
→ the long-term trend line (shown in orange);
→ the lower boundary of the downward channel;
→ the current yearly low around $135 per share.
It is possible that today's earnings report could provide a fundamental driver (e.g., higher-than-expected earnings per share) for a reversal upwards from this support block.
Meanwhile, forecasts remain optimistic. According to predictions from 34 Wall Street analysts surveyed by TipRanks, 28 recommend buying AMD shares. On average, they forecast AMD's price to reach $194.93 (nearly +40% from current levels) within 12 months.
Buy and sell stocks of the world's biggest publicly-listed companies with CFDs on FXOpen’s trading platform. Open your FXOpen account now or learn more about trading share CFDs with FXOpen.
This article represents the opinion of the Companies operating under the FXOpen brand only. It is not to be construed as an offer, solicitation, or recommendation with respect to products and services provided by the Companies operating under the FXOpen brand, nor is it to be considered financial advice.
Stay ahead of the market!
Subscribe now to our mailing list and receive the latest market news and insights delivered directly to your inbox.


Latest articles

European Currencies Decline: Pound Hits New Lows, Euro Under Pressure
European currencies continue to weaken against the US dollar amid rising geopolitical tensions and increased demand for safe-haven and liquid assets. Market participants are reducing exposure to riskier instruments, putting pressure on both the euro and the pound. Additional support

Market Analysis: GBP/USD Dips Further As EUR/GBP Regains Traction
GBP/USD failed to climb above 1.3500 and corrected some gains. EUR/GBP started a decent increase and might aim for more gains above 0.8700.
Important Takeaways for GBP/USD and EUR/GBP Analysis Today
· The British Pound
