


FXOpen

In the first nine months of 2024, the GBP/CAD exchange rate rose by over 7%, surpassing the significant 1.800 level.
The last time GBP/CAD remained consistently above this level was back in 2016, but it later dropped below. Since then, bulls have made two attempts to push the price above 1.800: in 2018 and again in 2020 (during the coronavirus panic) – both of which failed.
A third attempt occurred when GBP/CAD climbed above 1.800 in September 2024, but yesterday’s large bearish candles (marked with an arrow) suggest that this attempt to stay above 1.800 may also fail.
Yesterday’s decline in GBP/CAD was driven by a combination of factors, including:
→ A rise in oil prices, which strengthens the Canadian dollar as Canada is a major exporter of oil;
→ A slowdown in manufacturing activity in the UK during September, as reported by Reuters.
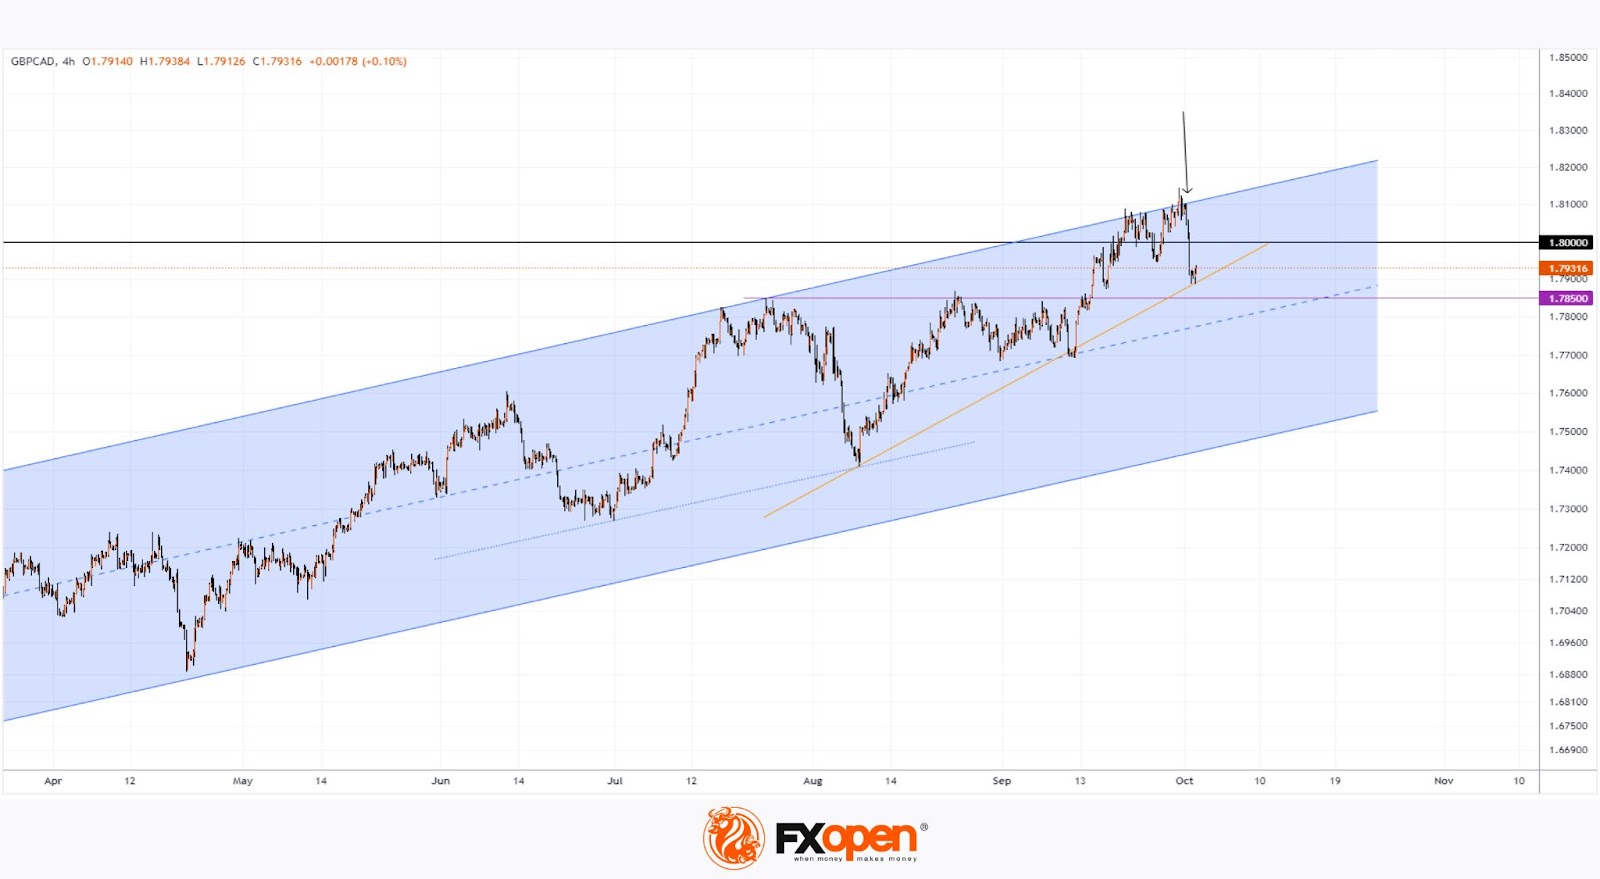
Technical analysis of the GBP/CAD chart shows the price is moving within an ascending channel (marked in blue), which has remained relevant since the start of 2024.
Support levels for the price could be
→ The 1.78500 level (which acted as resistance from mid-July before being broken in September);
→ The median line of the ascending channel;
→ The orange trendline.
However, it is possible that these support levels may not be strong enough to ensure that GBP/CAD can consistently hold above the 1.800 level, which has historically acted as key resistance.
Trade over 50 forex markets 24 hours a day with FXOpen. Take advantage of low commissions, deep liquidity, and spreads from 0.0 pips (additional fees may apply). Open your FXOpen account now or learn more about trading forex with FXOpen.
This article represents the opinion of the Companies operating under the FXOpen brand only. It is not to be construed as an offer, solicitation, or recommendation with respect to products and services provided by the Companies operating under the FXOpen brand, nor is it to be considered financial advice.
Stay ahead of the market!
Subscribe now to our mailing list and receive the latest market news and insights delivered directly to your inbox.


Latest articles

Market Analysis: GBP/USD Dips Further As EUR/GBP Regains Traction
GBP/USD failed to climb above 1.3500 and corrected some gains. EUR/GBP started a decent increase and might aim for more gains above 0.8700.
Important Takeaways for GBP/USD and EUR/GBP Analysis Today
· The British Pound


Market Insights with Gary Thomson: Oil, US Retail Sales & NFP in Focus
In this video, we’ll explore the key economic events and market trends, shaping the financial landscape. Get ready for insights into financial markets to help you navigate the week ahead. Let’s dive in!
In this episode of Market