


FXOpen
Yesterday, the Purchasing Managers' Index (PMI) data for both the UK and the US were released.
According to ForexFactory, the UK figures were as follows:
→ Flash Manufacturing PMI: actual = 52.5, forecast = 52.1; previous = 52.1;
→ Flash Services PMI: actual = 53.3, forecast = 52.8; previous = 52.5.
As SPGlobal reports, the August PMI data signalled another significant expansion (the largest since April) in the UK's private sector output, supported by strong growth in new orders.
In contrast, the US figures were less encouraging:
→ Flash Manufacturing PMI: actual = 48.0, forecast = 49.5; previous = 49.6;
→ Flash Services PMI: actual = 55.2, forecast = 54.0; previous = 55.0.
In response to yesterday’s PMI releases, the GBP/USD rate has been climbing this morning towards the 2023 high around the 1.3140 level. Notably:
→ Since the August low, the pair has risen by over 3.5%;
→ A key driver of bullish sentiment for GBP/USD is the weakness of the US dollar, driven by expectations of a Fed rate cut in September.
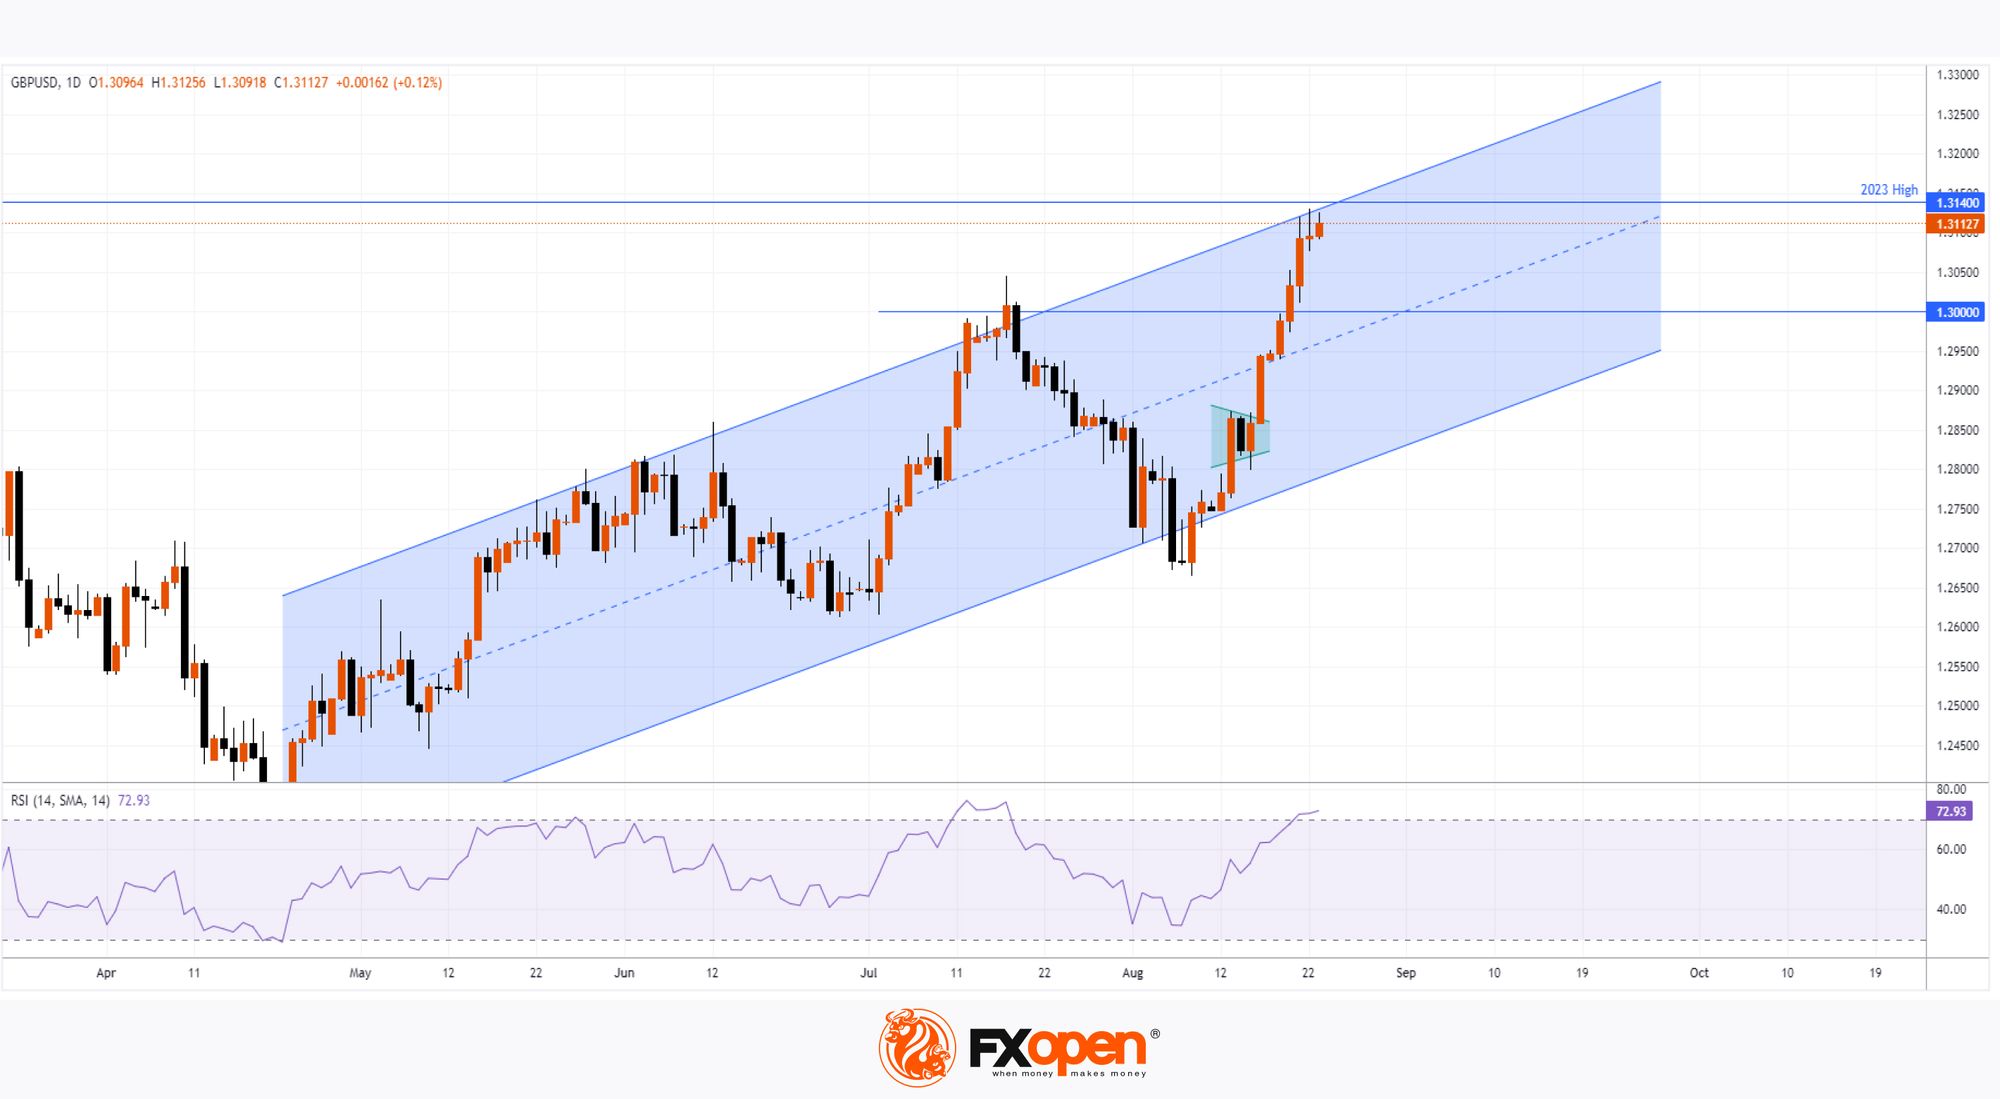
Technical analysis of the GBP/USD daily chart today shows:
→ The price has broken upwards out of the consolidation triangle (which we mentioned on 15 August) and confidently surpassed the psychological barrier at 1.3000;
→ The RSI indicator has entered overbought territory;
→ The last few daily candles show long upper shadows, indicating increased selling activity;
→ The upper boundary of the ascending channel (shown in blue) could act as resistance.
Given these factors, it is reasonable to suggest that the rally might be losing momentum, and even if the bulls manage to challenge the 2023 high, it could potentially result in a bull trap.
Trade over 50 forex markets 24 hours a day with FXOpen. Take advantage of low commissions, deep liquidity, and spreads from 0.0 pips (additional fees may apply). Open your FXOpen account now or learn more about trading forex with FXOpen.
This article represents the opinion of the Companies operating under the FXOpen brand only. It is not to be construed as an offer, solicitation, or recommendation with respect to products and services provided by the Companies operating under the FXOpen brand, nor is it to be considered financial advice.
Stay ahead of the market!
Subscribe now to our mailing list and receive the latest market news and insights delivered directly to your inbox.


Latest articles

European Currencies Decline: Pound Hits New Lows, Euro Under Pressure
European currencies continue to weaken against the US dollar amid rising geopolitical tensions and increased demand for safe-haven and liquid assets. Market participants are reducing exposure to riskier instruments, putting pressure on both the euro and the pound. Additional support

Market Analysis: GBP/USD Dips Further As EUR/GBP Regains Traction
GBP/USD failed to climb above 1.3500 and corrected some gains. EUR/GBP started a decent increase and might aim for more gains above 0.8700.
Important Takeaways for GBP/USD and EUR/GBP Analysis Today
· The British Pound
