


FXOpen
According to the NZD/USD chart, the exchange rate has reached 0.635 New Zealand dollars per US dollar today, its highest level since December 2023.
As reported by Trading Economics:
→ On one hand, the "kiwi" strengthened due to China's announcement of an economic stimulus package, as China is New Zealand's largest trading partner.
→ On the other hand, weaker-than-expected US consumer confidence data (CB Consumer Confidence) released yesterday also supported the pair: actual = 98.7, forecast = 103.9, previous = 105.6.
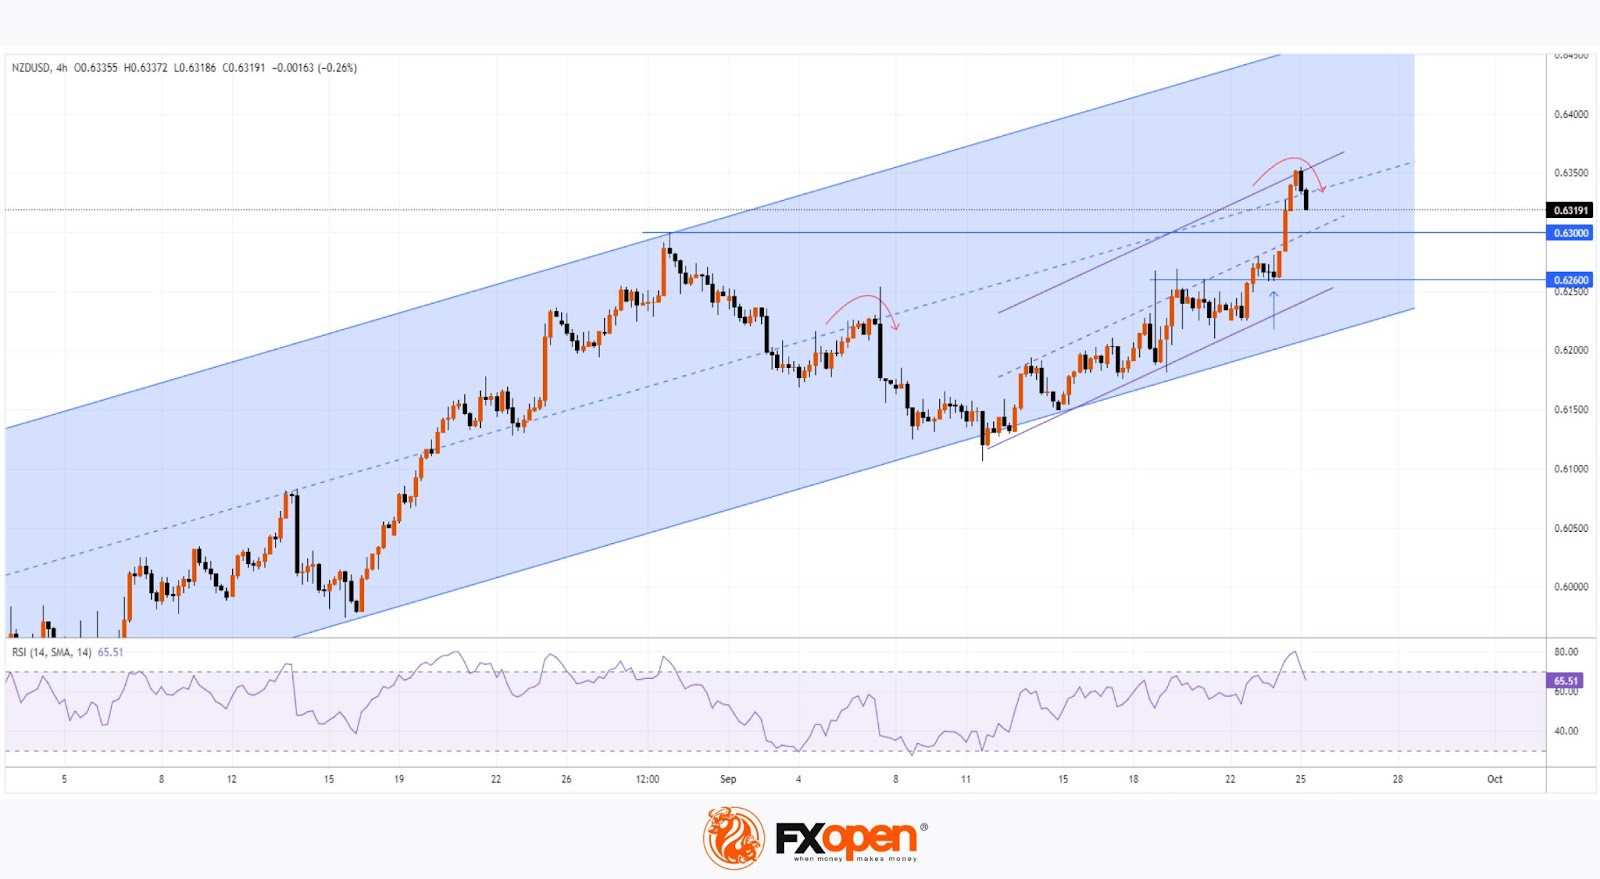
Today's technical analysis of the NZD/USD chart shows that since late July, the price has formed an upward channel (marked in blue), with the following developments:
→ Bulls managed to break the 0.630 level;
→ The 0.626 level shifted from resistance to support (indicated by an arrow);
→ Since mid-September, the price rise has been most clearly reflected by a steeper upward channel (shown by purple lines);
→ The RSI indicator on the 4-hour timeframe entered the overbought zone and has turned downwards.
It's worth noting that today’s NZD/USD chart indicates the median line is showing signs of resistance, as seen earlier in September.
Given this, the market appears vulnerable to a pullback, and we may witness a retest of the 0.630 level, reinforced by support from the purple lines.
Trade over 50 forex markets 24 hours a day with FXOpen. Take advantage of low commissions, deep liquidity, and spreads from 0.0 pips (additional fees may apply). Open your FXOpen account now or learn more about trading forex with FXOpen.
This article represents the opinion of the Companies operating under the FXOpen brand only. It is not to be construed as an offer, solicitation, or recommendation with respect to products and services provided by the Companies operating under the FXOpen brand, nor is it to be considered financial advice.
Stay ahead of the market!
Subscribe now to our mailing list and receive the latest market news and insights delivered directly to your inbox.


Latest articles

Market Analysis: GBP/USD Dips Further As EUR/GBP Regains Traction
GBP/USD failed to climb above 1.3500 and corrected some gains. EUR/GBP started a decent increase and might aim for more gains above 0.8700.
Important Takeaways for GBP/USD and EUR/GBP Analysis Today
· The British Pound


Market Insights with Gary Thomson: Oil, US Retail Sales & NFP in Focus
In this video, we’ll explore the key economic events and market trends, shaping the financial landscape. Get ready for insights into financial markets to help you navigate the week ahead. Let’s dive in!
In this episode of Market