


Analysis of NZD/USD: Price Approaches Key Resistance Zone
FXOpen

The NZD/USD chart today shows that the New Zealand dollar has risen by over 3% against the USD in less than a week. From another perspective, the NZD/USD rate has climbed more than 5% from its August low.
The volatility in the exchange rate was influenced by the Reserve Bank of New Zealand's decision to cut interest rates, as reported on 14 August.
Technical analysis of the NZD/USD chart reveals:
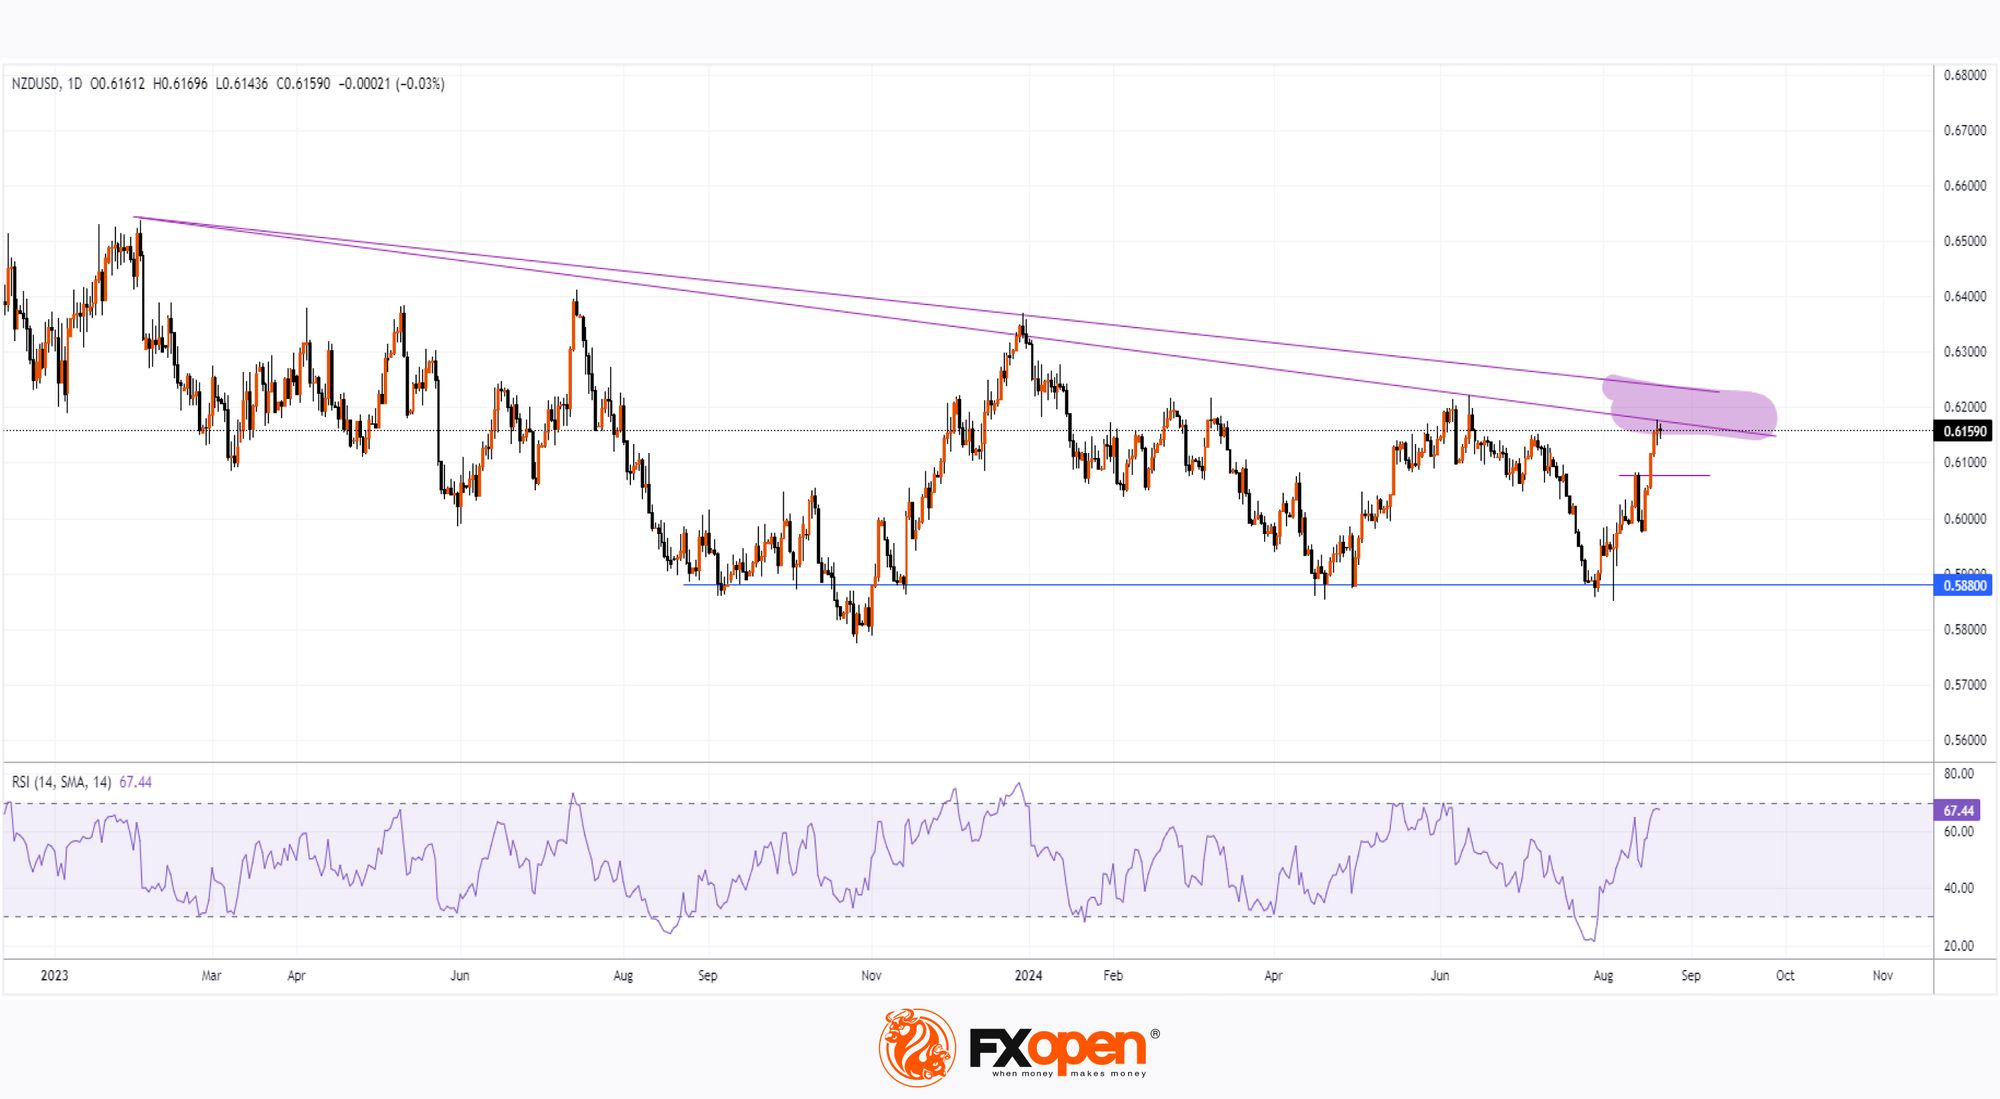
→ The current bullish sentiment has pushed the RSI indicator from the oversold into the overbought zone.
→ The 0.60770 level, which marked the peak on 13-14 August, may now act as support following its bullish breakout on 19 August.
More notably, the NZD/USD rate has entered a resistance zone (marked in purple), formed by trendlines drawn through key highs of 2023-2024. This could potentially slow the upward momentum.
As a result, the NZD/USD chart might continue to see significant fluctuations between this resistance zone and the critical support at 0.588 (a level where the price has repeatedly attempted, but failed, to break below over the past 12 months).
Investor attention now shifts to Federal Reserve Chair Jerome Powell's speech at the Jackson Hole symposium on Friday, which could trigger a surge in volatility and provide insights into how strongly the resistance zone is impacting the NZD/USD rate.
Trade over 50 forex markets 24 hours a day with FXOpen. Take advantage of low commissions, deep liquidity, and spreads from 0.0 pips (additional fees may apply). Open your FXOpen account now or learn more about trading forex with FXOpen.
This article represents the opinion of the Companies operating under the FXOpen brand only. It is not to be construed as an offer, solicitation, or recommendation with respect to products and services provided by the Companies operating under the FXOpen brand, nor is it to be considered financial advice.
Stay ahead of the market!
Subscribe now to our mailing list and receive the latest market news and insights delivered directly to your inbox.


Latest articles

NVDA Shares Approach Strong Resistance
Production of NVIDIA processors is concentrated in Taiwan via TSMC, making the company sensitive to US trade policy. In the first quarter of fiscal 2026, NVIDIA recorded a $4.5bn write-down due to restrictions on H20 chip exports to China.

Euro and Sterling Weaken as the Dollar Strengthens Ahead of Key US Data
The US dollar continues to hold firm against its major counterparts, supported by strong US macroeconomic data and expectations surrounding the release of further labour market indicators. Additional support for the greenback comes from persistent inflationary risks and the Federal

Gold: Attempt to Break Out of the Short-Term Trend
Fundamental backdrop
In April, US inflation stood at 3.8% year-on-year — the highest level since May 2023. A significant contribution came from rising fuel prices amid escalating tensions in the Middle East. Market reaction was somewhat paradoxical: instead of inflows