


FXOpen

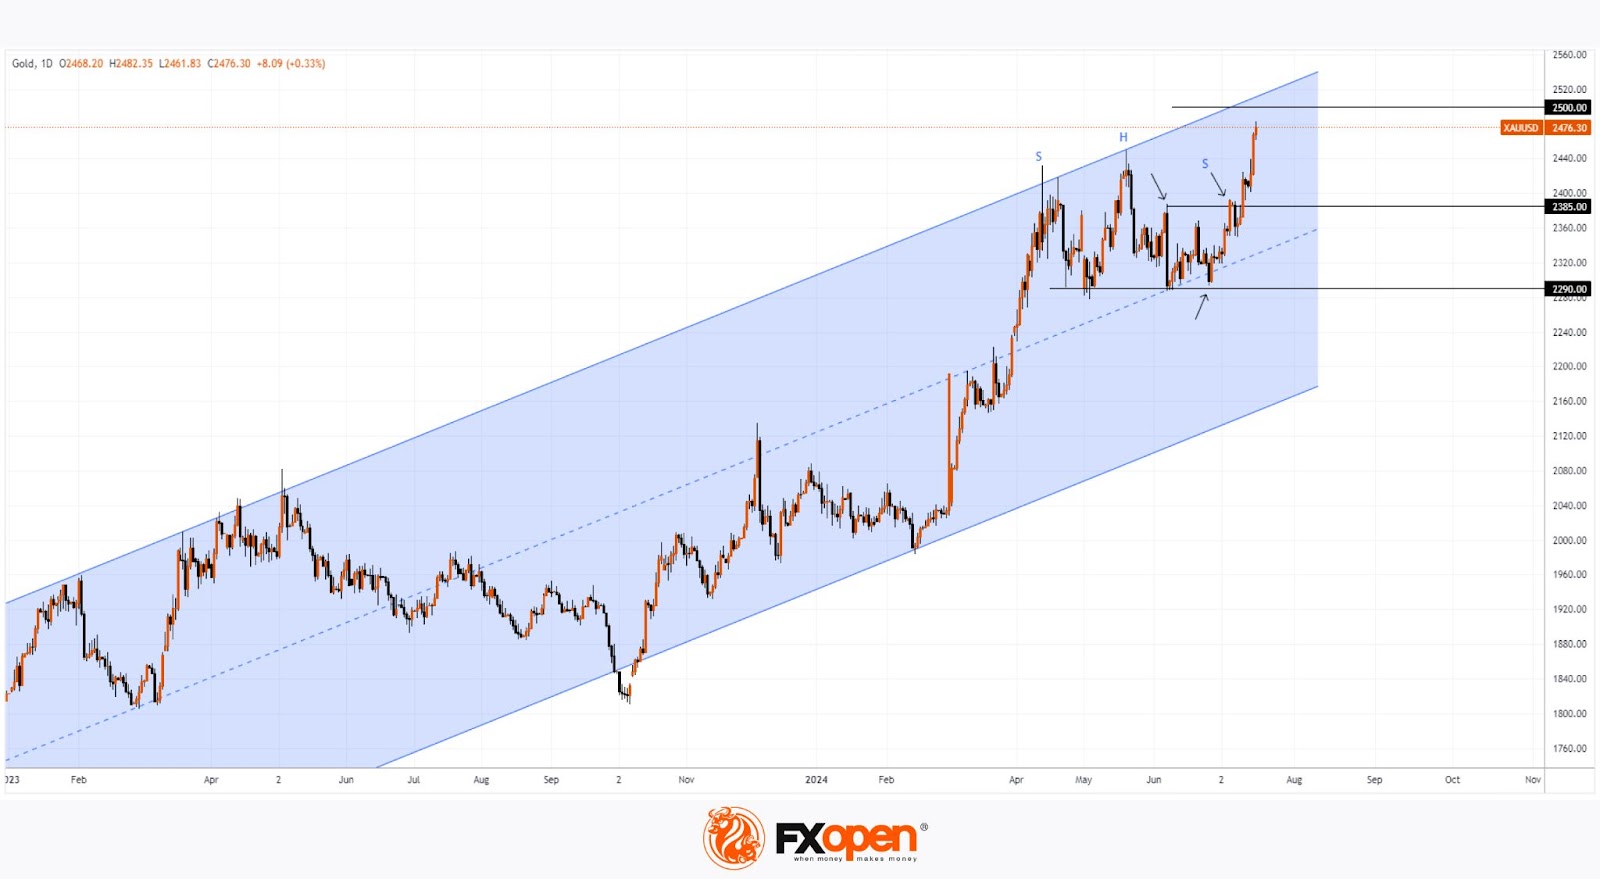
As the XAU/USD chart shows, on 16th July, the gold price rose above $2460 for the first time in history. The bullish sentiment is driven by:
→ Anticipation of Fed rate cuts, as the appeal of non-yielding bullion generally increases in low-interest-rate environments.
→ Geopolitical tensions, with an attempt on Trump's life possibly boosting demand for the "safe-haven asset."
→ Demand from central banks.
Reuters reports that analysts at Commonwealth Bank of Australia believe the gold price could exceed their forecast of $2500 per ounce by the end of 2024. "It is worth highlighting gold's ability to find support under any conditions this year," they say.
Can the gold price rise further?
Technical analysis of the XAU/USD chart provides valuable insights:
→ The gold price is in an upward trend (shown in blue).
→ The support level at $2290, reinforced by the median line of the blue channel, pushed the price up (shown by an arrow).
→ The bulls managed to break the $2385 level, which had acted as resistance since 7 June (shown by arrows).
→ The bearish Head and Shoulders (SHS) pattern failed.
The contours of the upward channel suggest the potential for the gold price to rise to its upper boundary, where the psychological level of $2500 per ounce also lies. Thus, the Commonwealth Bank of Australia's forecast could come true much earlier than the end of 2024.
Start trading commodity CFDs with tight spreads (additional fees may apply). Open your trading account now or learn more about trading commodity CFDs with FXOpen.
This article represents the opinion of the Companies operating under the FXOpen brand only. It is not to be construed as an offer, solicitation, or recommendation with respect to products and services provided by the Companies operating under the FXOpen brand, nor is it to be considered financial advice.
Stay ahead of the market!
Subscribe now to our mailing list and receive the latest market news and insights delivered directly to your inbox.


Latest articles

European Currencies Decline: Pound Hits New Lows, Euro Under Pressure
European currencies continue to weaken against the US dollar amid rising geopolitical tensions and increased demand for safe-haven and liquid assets. Market participants are reducing exposure to riskier instruments, putting pressure on both the euro and the pound. Additional support

Market Analysis: GBP/USD Dips Further As EUR/GBP Regains Traction
GBP/USD failed to climb above 1.3500 and corrected some gains. EUR/GBP started a decent increase and might aim for more gains above 0.8700.
Important Takeaways for GBP/USD and EUR/GBP Analysis Today
· The British Pound
