


Head and Shoulders Pattern Trading
FXOpen
The head and shoulders chart pattern is a popular tool, and for this reason, it’s highly likely that you’ve heard of it. It has simple trading rules and identifies precise entry and exit points, allowing traders with little experience to use it right away. In this FXOpen guide, we will dive into the topic and explain how the pattern works.
Head and Shoulders Formation
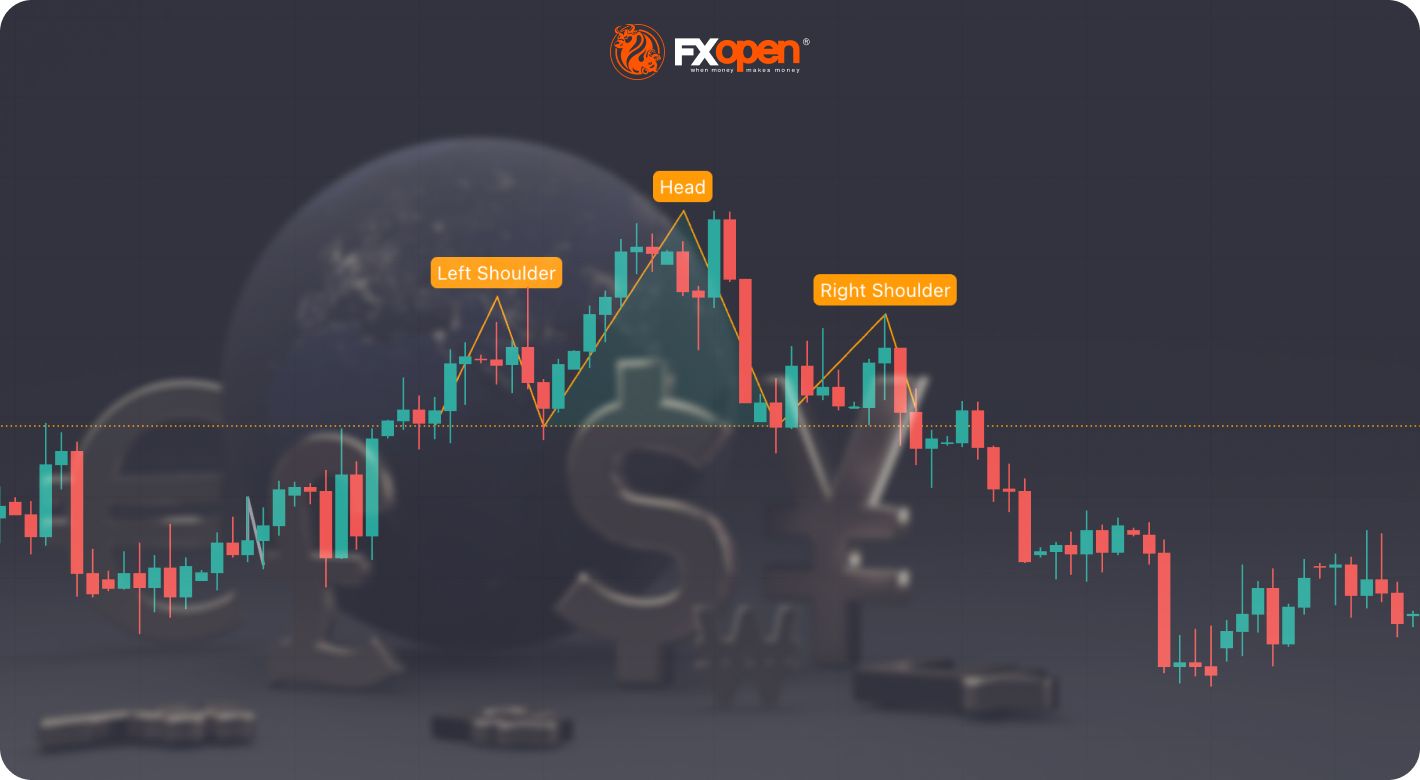
A head and shoulders, or bearish head and shoulder, formation is used by traders to predict a potential trend reversal. It consists of three tops, with the middle top being the highest and the two other tops being slightly lower, at almost the same level as each other. The two lower peaks are referred to as the left and right shoulders, while the middle peak is the head. The setup is considered complete when the price breaks through the neckline, which signals a potential trend reversal and is accompanied by a surge in volume, indicating a strong shift in market sentiment. The neckline is a line drawn through the lows between the two shoulders.
The psychology behind this formation is that the price moves in a strong uptrend, and the trend is confirmed by the left shoulder and the head, which together form higher highs. However, bulls lose their strength and can only drive the price to a level equal to the first top. After that, bears take control of the market and pull the price down.
How to Draw a Head and Shoulders Trading Pattern
To draw this formation, you need to:
- Determine the uptrend.
- Identify the first peak and wait for the price to form a higher high. This will be the head.
- Check that the third high is lower than the second but at almost the same level as the first.
- Draw a line connecting lows between the shoulders once the three peaks are identified. This line should be almost horizontal. If the second low is much deeper than the first, it will be the Quasimodo pattern.
Traders can use a head and shoulders pattern screener to scan the market for potential trading opportunities. Screeners use algorithms to identify and highlight assets that have formed the pattern.
However, it's easy to identify this by eye. You can use an implemented tool to draw the pattern using the TickTrader platform, which will mark the shoulders, the head, and the neckline.
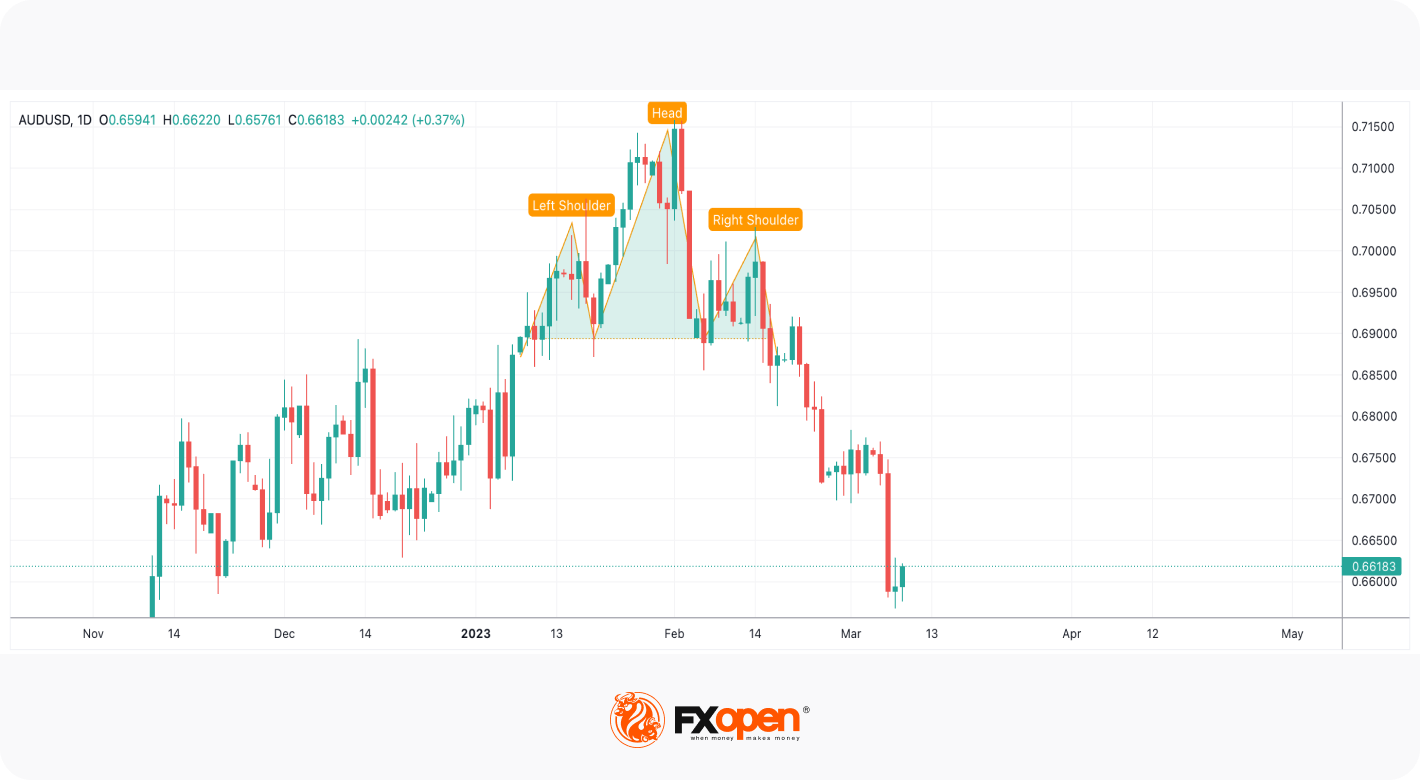
Example
This AUD/USD price chart shows an uptrend, with the head and shoulders formation on the top. The price forms the left shoulder, then by making another swing, it forms the head, and after moving down, it finishes the setup with the right shoulder. The neckline goes through the lows between the left and right shoulders. Once the pattern is formed, the price breaks below the neckline and continues falling.
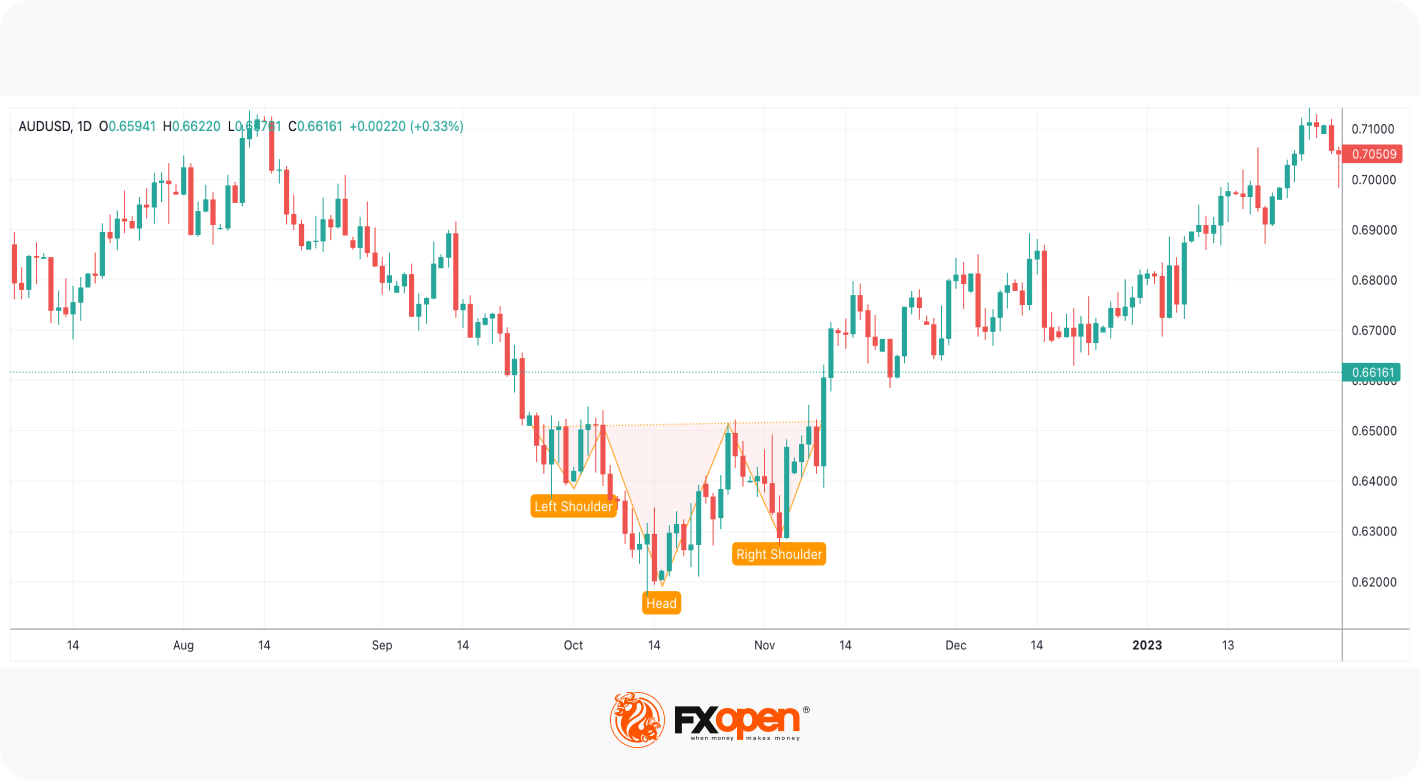
Inverse Head and Shoulders Pattern
Is the head and shoulders formation bullish or bearish? It can be either, depending on whether it is formed after an uptrend or a downtrend. A bearish head and shoulders setup is typically formed after an extended uptrend, and it signals a potential trend reversal from bullish to bearish. A bullish, or inverse, head and shoulders pattern is usually formed after an extended downtrend and signals a possible trend reversal from bearish to bullish.
The bullish formation consists of a bottom, followed by a lower swing, which is followed by a higher bottom. The two higher bottoms are referred to as the left and right shoulders, while the middle bottom is the head. The neckline connects two peaks between the shoulders. We can consider that the pattern worked only if the price breaks above the neckline.
Head and Shoulders Trading Strategy
Traders use the pattern to identify precise entry and exit points. They typically wait for the price to break through the neckline to enter a trade, which signals a potential trend reversal. If a bearish pattern forms, you can enter a short position; if a bullish setup appears on a price chart, you can open a long position.
To manage risks, traders typically place a stop-loss order above the neckline in a bearish formation and below the neckline in a bullish setup. The distance varies, so a trader should analyse current market conditions as well as the nearest resistance (bearish formation) and support (bullish formation) levels. One of the techniques is to place the stop-loss orders in the middle of the second shoulder.
Some analysts suggest traders place the stop-loss order above the second shoulder. This helps limit potential losses if the formation doesn't play out as expected. However, such an approach may provide an ineffective risk/reward ratio. Placing a stop loss on the neckline is dangerous, as the price often retests it before moving in the breakout direction.
To estimate the profit target, traders measure the height of the head and use it to project the potential downward move. In a bullish head and shoulders pattern, they measure the distance from the neckline to the head and use it to project the possible upward move.
It's important to note that the pattern shouldn’t be used to analyse market trends on its own – you should combine it with other tools and fundamental analysis methods.
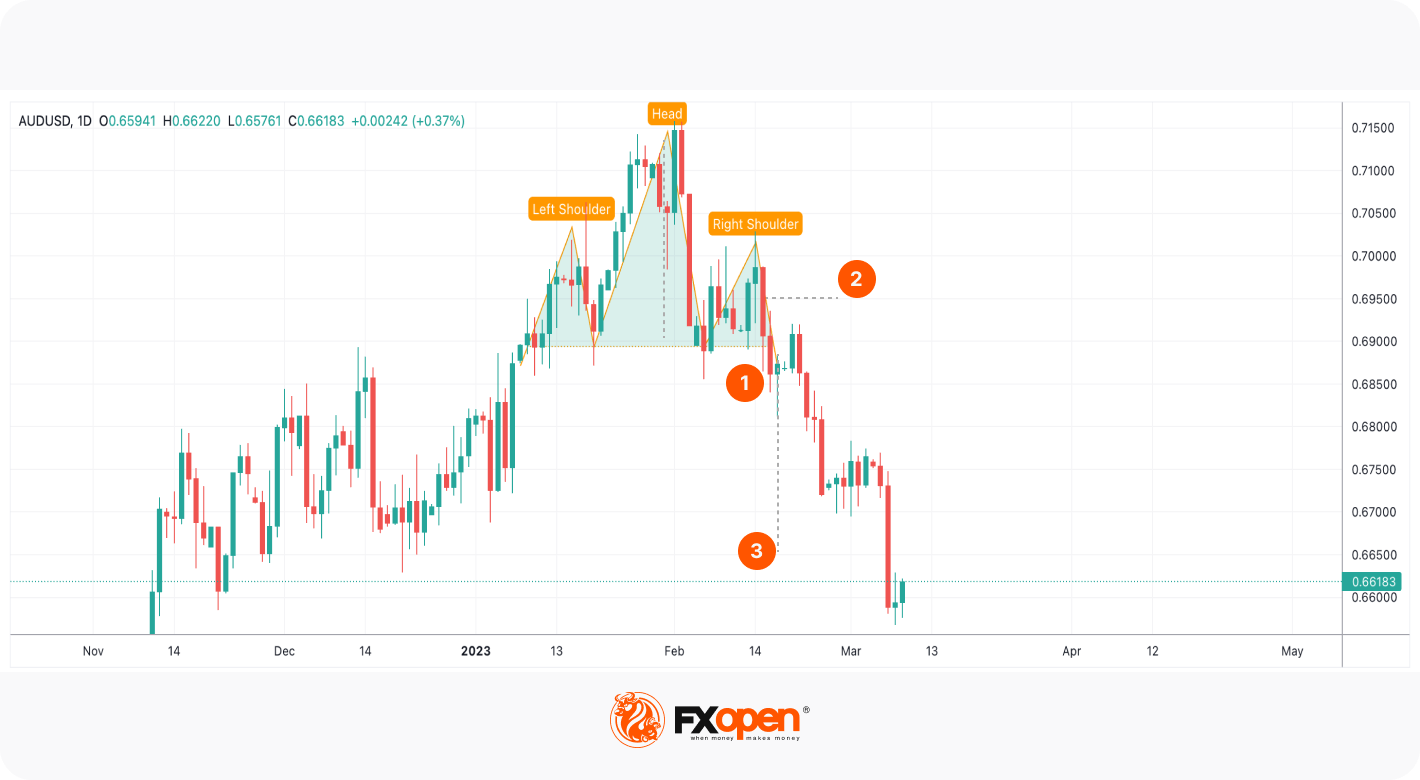
Head and Shoulders: Trading Example
On the daily chart of the AUD/USD pair, the price formed the head and shoulders pattern. You could enter the trade on the neckline breakout (1). If you had placed a stop-loss order in the middle of the second shoulder, you would have stayed in the market, even though the price retested the neckline (2). The take-profit target would equal the distance between the head and the neckline (3).
Can You Rely on the Head and Shoulders Pattern?
The reliability of the pattern is a topic of debate among traders. While some swear by it, others argue that it is unreliable and prone to false signals.
One of the criticisms is that it is subjective and that different traders may draw it differently. This may lead to false signals and confusion.
Another point pessimists make is that the pattern provides lagging signals and that by the time it is complete, the trend may have already reversed.
Some critics argue that the price breaks below the neckline and moves a distance equal to the length between the head and the neckline but turns around, so a solid trend doesn’t form.
Despite these criticisms, many traders still use this tool because it has simple trading rules and can be used in various markets. That is, the forex head and shoulders pattern rules will be the same as those for stock, commodity, cryptocurrency*, and index head and shoulders setups.
Final Thoughts
The head and shoulders is a popular tool among traders. They use it to predict potential trend reversals and enter and exit trades at precise points. However, the reliability of this formation is a topic of debate, and the theory suggests traders use other technical analysis instruments and fundamental analysis to confirm its signals. You can decide for yourself whether you want to use it. Open an FXOpen account and test it on different timeframes and in various markets.
*At FXOpen UK and FXOpen AU, Cryptocurrency CFDs are only available for trading by those clients categorised as Professional clients under FCA Rules and Professional clients under ASIC Rules, respectively. They are not available for trading by Retail clients.
This article represents the opinion of the Companies operating under the FXOpen brand only. It is not to be construed as an offer, solicitation, or recommendation with respect to products and services provided by the Companies operating under the FXOpen brand, nor is it to be considered financial advice.
Stay ahead of the market!
Subscribe now to our mailing list and receive the latest market news and insights delivered directly to your inbox.


Latest articles

Intel at a Crossroads: Earnings Beat Meets Technical Resistance
Intel has just delivered its strongest quarter in over fifteen years, and the market reaction says it all. Q2 2026 revenue surged 25% year-over-year to $16.1 billion, crushing the consensus estimate of $14.42 billion, while adjusted EPS of

Tesla: Complex Range Structure Breaks Down Following Quarterly Earnings
Tesla released its Q2 2026 results after the market closed on 22 July. Revenue increased 26% year-on-year to $28.24 billion, while vehicle deliveries reached a record 480,126 units. However, operating margin fell sharply to 1.4%, down from

Pound Weakens After Soft UK Inflation Data as Euro Awaits Fresh Market Signals
The pound remains under pressure following the release of weaker-than-expected UK inflation data. The slowdown in inflation has strengthened expectations that the Bank of England could adopt a more accommodative policy stance in the coming months, weighing on sterling. Meanwhile,